
The SSD Review uses benchmark software called PCMark Vantage x64 HDD Suite to create testing scenarios that might be used in the typical user experience. There are eight tests in all and the tests performed record the speed of data movement in MB/s to which they are then given a numerical score after all of the tests are complete. The simulations are as follows:
- Windows Defender In Use
- Streaming Data from storage in games such as Alan Wake which allows for massive worlds and riveting non-stop action
- Importing digital photos into Windows Photo Gallery
- Starting the Vista Operating System
- Home Video editing with Movie Maker which can be very time consuming
- Media Center which can handle video recording, time shifting and streaming from Windows media center to an extender such as Xbox
- Cataloging a music library
- Starting applications
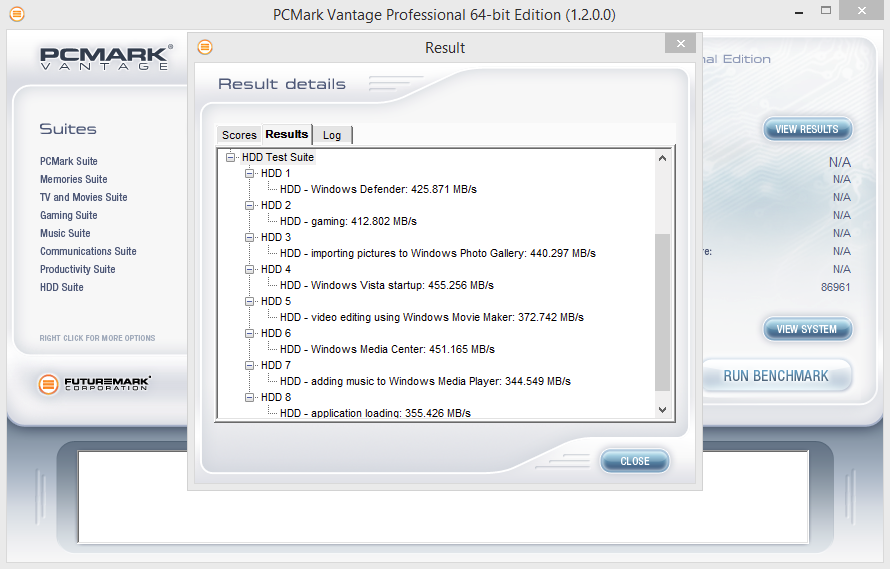
PCMARK VANTAGE RESULTS
In PCMark Vantage, both capacities performed reasonably well. The Samsung 850 EVO M.2 120GB (results pictured left) achieved a Total Score of 86,961 points with a high transfer speed of 455MB/s during the “Windows Vista Startup” phase. The Samsung 850 EVO M.2 500GB achieved a Total Score of 85,745 points with a high transfer speed of 452MB/s during the “Windows Vista Startup” phase as well. The “adding music to Windows Media Player” results were the lowest with both SSDs reaching 345MB/s and 335MB/s respectively.

For our last benchmark, we have decided to use PCMark 8 Extended Storage Workload in order to determine steady state throughput of the SSD. This software is the longest in our battery of tests and takes just under 18 hours per SSD. As this is a specialized component of PCMark 8 Professional, its final result is void of any colorful graphs or charts typical of the normal online results and deciphering the resulting excel file into an easily understood result takes several more hours.
There are 18 phases of testing throughout the entire run, 8 runs of the Degradation Phase, 5 runs of the Steady State Phase and 5 runs of the Recovery Phase. In each phase, several performance tests are run of 10 different software programs; Adobe After Effects, Illustrator, InDesign, Photoshop Heavy and Photoshop Light, Microsoft Excel, PowerPoint and Word, as well as Battlefield 3 and World of Warcraft to cover the gaming element.
- PRECONDITIONING -The entire SSD is filled twice sequentially with random data of a 128KB file size. The second run accounts for overprovisioning that would have escaped the first;
- DEGRADATION PHASE – The SSD is hit with random writes of between 4KB and 1MB for 10 minutes and then a single pass performance test is done of each application. The cycle is repeated 8 times, and with each time, the duration of random writes increases by 5 minutes;
- STEADY STATE PHASE – The drive is hit with random writes of between 4KB and 1MB for 45 minutes before each application is put through a performance test. This process is repeated 5 times;
- RECOVERY PHASE – The SSD is allowed to idle for 5 minutes before and between performance tests of all applications. This is repeated 5 times which accounts for garbage collection; and
- CLEANUP – The entire SSD is written with zero data at a write size of 128KB
In reading the results, the Degrade and Steady State phases represent heavy workload testing while the recovery phase represents typical consumer light workload testing.
As you can see, performance is recorded in terms of Bandwidth and Latency. Bandwidth (or throughput) represents the total throughput the drive is able to sustain during the tests during each phase. Latency, at least for the purposes of PCMark 8, takes on a different outlook and for this, we will term it ‘Total Storage Latency’. Typically, latency has been addressed as the time it takes for a command to be executed, or rather, the time from when the last command completed to the time that the next command started. This is shown below as ‘Average Latency’.
PCMark 8 provides a slightly different measurement, however, that we are terming as ‘Total Storage Latency’. This is represented as being the period from the time the last command was completed, until the time it took to complete the next task; the difference of course being that the execution of that task is included in ‘Total Storage Latency’. For both latency graphs, the same still exists where the lower the latency, the faster the responsiveness of the system will be. While both latency charts look very similar, the scale puts into perspective how just a few milliseconds can increase the length of time to complete multiple workloads.
For a more in-depth look into Latency, Bandwidth, and IOPS check out our primer article on them here.
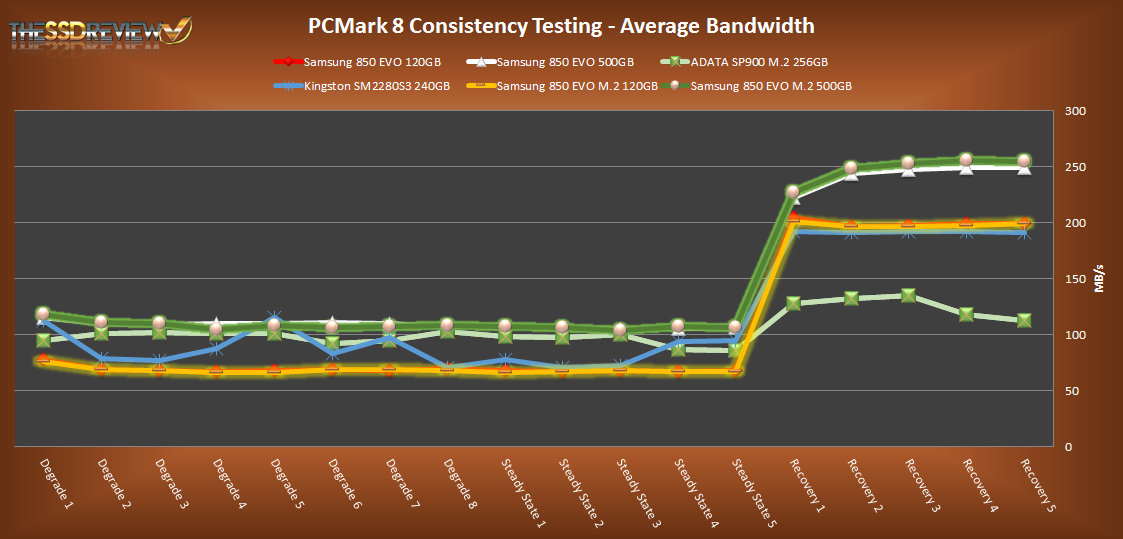
AVERAGE BANDWIDTH (OR THROUGHPUT)
These results show the total average bandwidth across all tests in the 18 phases. In this graph the higher the result the better.
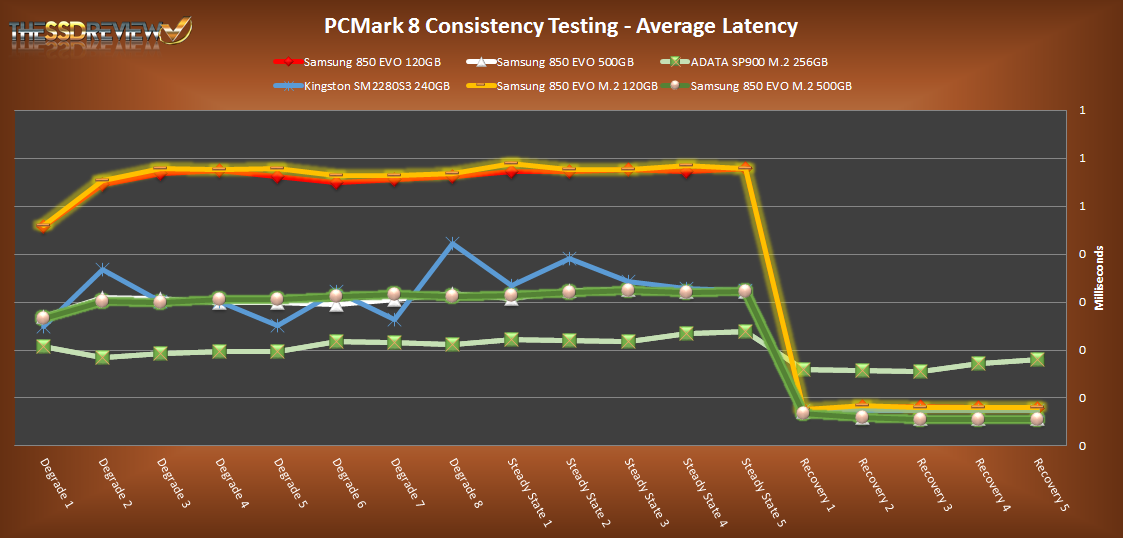
AVERAGE LATENCY (OR ACCESS TIME)
These results show the average access time during the workloads across all tests in the 18 phases. In this graph the lower the result the better.
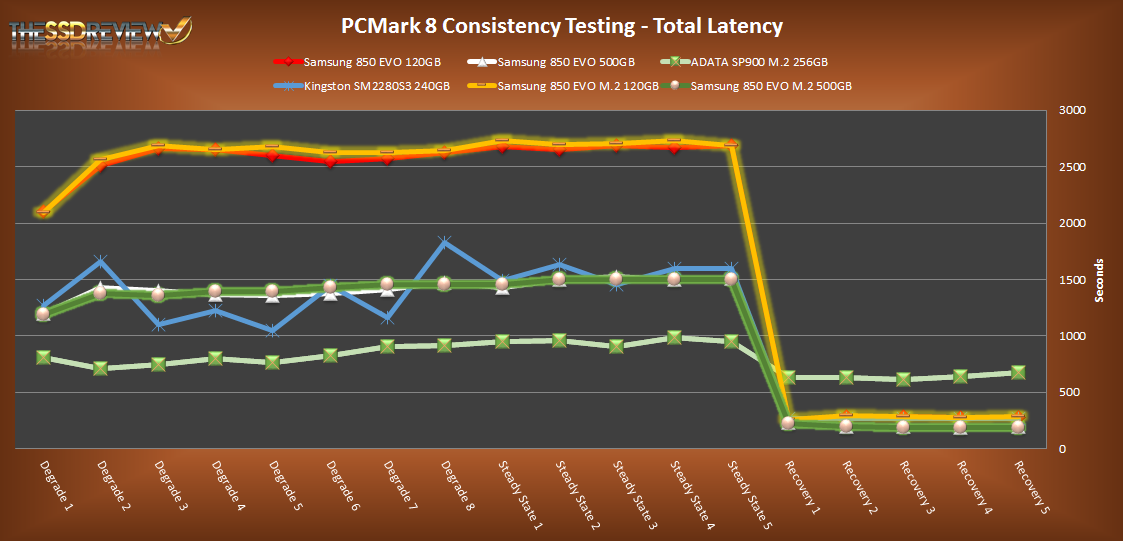
TOTAL STORAGE LATENCY
These results show the total access time across all tests in the 18 phases. In this graph the lower the result the better.
One thing we see here is that the Samsung 850 EVO M.2 is insanely consistent. Adding on that, where 500GB capacity is like a solid line the 120GB has ever so slight deviations but still relatively consistent. Overall, the 500GB has higher average bandwidth and lower latency than the 120GB and their performance is almost identical to their SATA III counterparts. Also, the 500GB has the highest average bandwidth out of the M.2 SSDs we tested in the graphs above.
Anandtech had a Review today there they said that they can´t recomend it becouse of that it slows down sometimes here i found no problem in the review
That’s what is great about independent reports. If we would have noticed such, it would have been posted and, in fact, , would have been more than evident in PCMark tests which span just under 24 hours of pushing the SSDs nonstop.
Probably you didn’t read either review since anandtech refers to the 1tb msata model only, and this review isn’t about the 1tb msata model .
Ah sorry it was the 1Tb 850 Msata not the M.2 But it also have been quiet about the problem with 840 eco and pro for a long time now
I am sorry but I have a question before purchasing I am considering to upgrade my Samsung notebook series 9 plus that with 128gb m2 which manufacture by Toshiba. Will this fit into the slot, well I took it out once, it look to me that about the same size and the slot is fit by the picture but I just want to make sure because I do not like to buy and return. Thank you
It depends on the allowable form factor. There are multiple sizes that vary in length. The most common are 2260 and 2280.
So this runs over SATA 3? Isn’t that limited to 6GB rather than the 10GB ?
I believe so, if author can confirm that would be gr8.
https://www.guru3d.com/articles-pages/intel-750-nvme-1-2-tb-pcie-ssd-review,8.html
are these easy to boot from? I would say yes if they still use the sata port right?
One observed characteristic of the 120 GB board is that when writing a large file (4.7 GB), the first 1GB of data writes at 500 MB/s but the speed drops to 150 MB/s for the remaining 3.7 GB. Reads occur at full speed. The larger capacity boards don’t seem to have this problem.