
SERVER PROFILES
As long as storage systems have been around, their users and managers have always wanted to know how theyd perform under approximate test conditions. If the system is going to be used for email, how does it do with a simulated workload? There are several simulated workloads that are representative of common workloads; database performance, fileserver, and so on. But before we log any results, we first have to run the workload until performance stops rising and falling over time. Once thats done, we can test the server profile at QD1 through QD128.
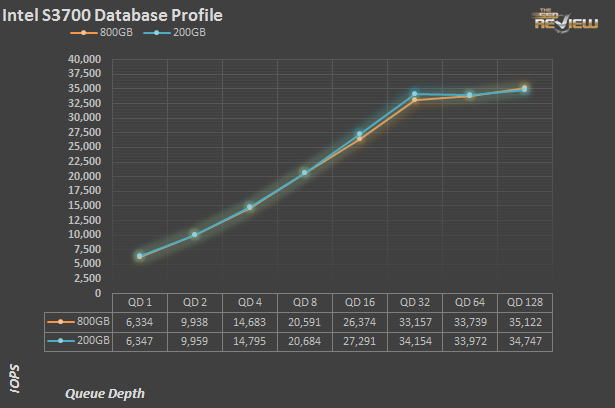
The database profile is 8K transfers, and 67% percent of operations are reads.
So far as can be discerned, the 200GB and 800GB are basically identical in terms of performance. Despite the nearly 10% advantage in steady state 4K writes (and consequently 8Ks as well), performance on the database profile is essentially the same. We don’t show the hours and hours of preconditioning for each server profile prior to the logging of data, but those too are nearly identical as well.

The exchange server profile breaks down on a 68% read/32% write bias, composed of only 32K transfers. It is similar in terms of read write mix to the database profile, but the primary transfer size of 32K is four times larger.
Again, both drives are virtually indistinguishable. At higher queue depths, the two Intel drives are holding down around 8,000 IOPS, or just around 1/4 of the transactions per second as the database profile. That makes sense, as the transfer size is four times larger.
The fileserver profile is based on an 80% read/20% write mix. Its made up of blocksizes from 512 to 64K, each making up a different percentage of the access pattern.
The pattern is: 512 bytes=10%, 1k=5%,2k=5%, 4k=60%, 8k=2%, 16k=4%, 32k=4%, 64k=10%.
Here is where we see the first deviations between the 800GB S3700 and the 200GB DC S3700 SSD. From QD 4 on, the big Intel manages as much as 20% more IOs per second as the smaller drive. Given the complexity of the workload, both drives handle themselves well.
The webserver profile is similar to the fileserver profile, but has some additional 128K and 512K accesses thrown in for good measure. Additionally, the profile is 100% read.
When there are no writes involved, both drives perform identically. At QD 32, the 800GB hits 23,156 IOPS. The 200GB? It also makes exactly 23,156 IOPS. Pretty amazing, given that performance from one run to the next can vary by a couple percent under the best of circumstances.
Awesome product again, but price is very strange its equal to capacity i mean 2x100GB is exactly the same as 1x200GB and so on. For enterprise server more capacity is logical (save power & room), but for mid range servers its a kill – deal to buy smaller drives price/performance it will be a lot more then awesome.
Are you still using IOMeter to generate you test data? Also, are you testing the drive raw, or with a logical file system? Great review!!
On page 5, it’s described that this SSD uses deduplication.. is it right? Because I don’t find Intel has mentioned it elsewhere.. thanks for the great review.