
PCMARK 10 FULL SYSTEM STORAGE BENCHMARK
PCMark 10 Storage Benchmarks produce an overall score as a measure of drive performance. Comparing devices is as simple as comparing scores. The tests also measure and report the bandwidth and average access time performance for the drive. Each test uses traces recorded while performing real-world tasks such as booting Windows 10, starting applications such as Adobe Photoshop and Illustrator, working with applications such as Microsoft Excel and PowerPoint, and copying several large files and many small files.
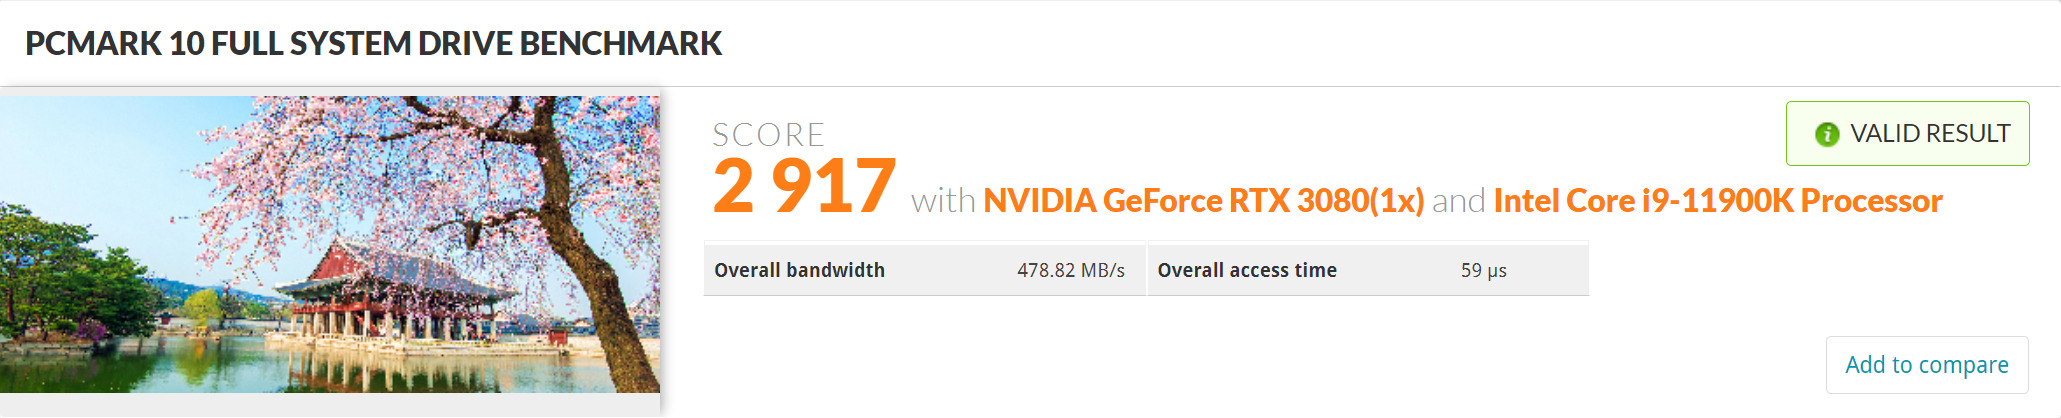
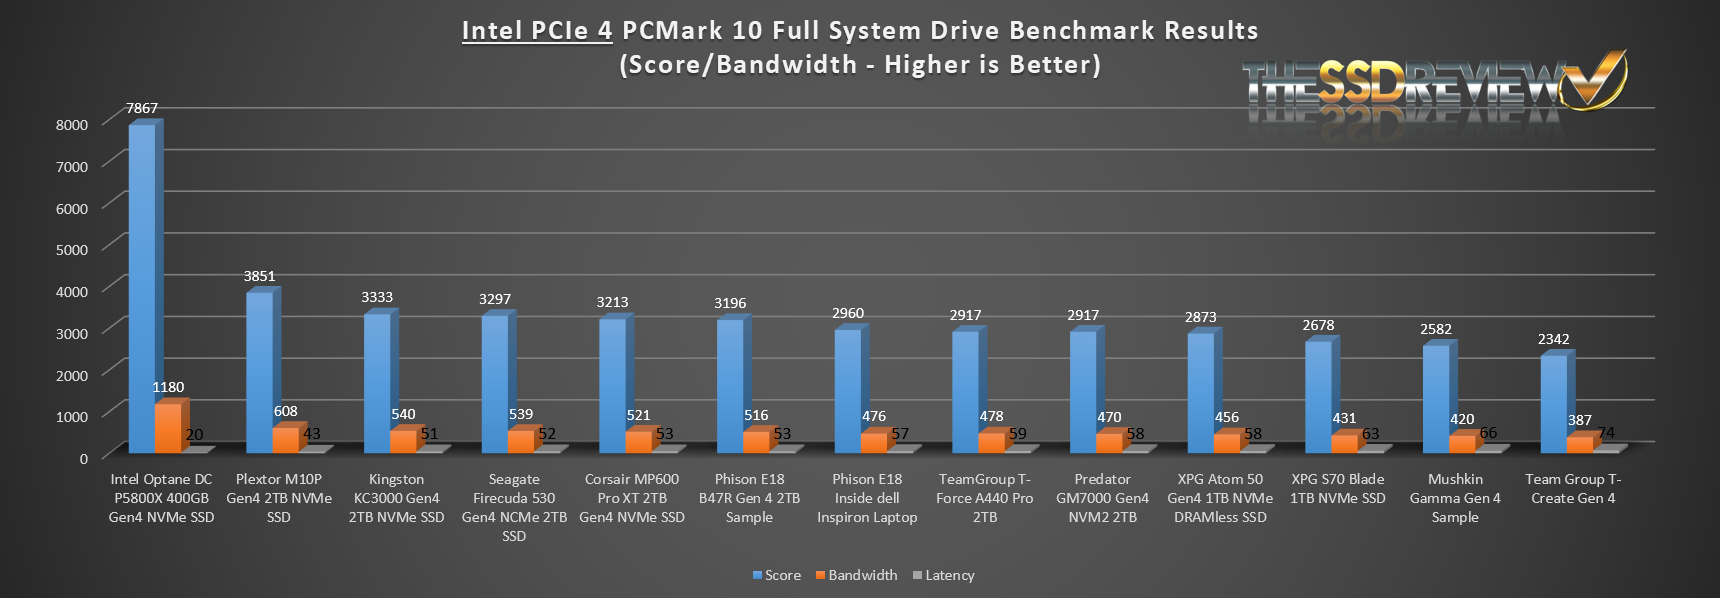
In doing a comparison of other drives that we have tested on this Intel Test Bench, the TeamGroup T-Force Cardea A440 Pro placed eighth with an overall bandwidth of 478MB/s.
PCMARK 10 QUICK SYSTEM STORAGE BENCHMARK
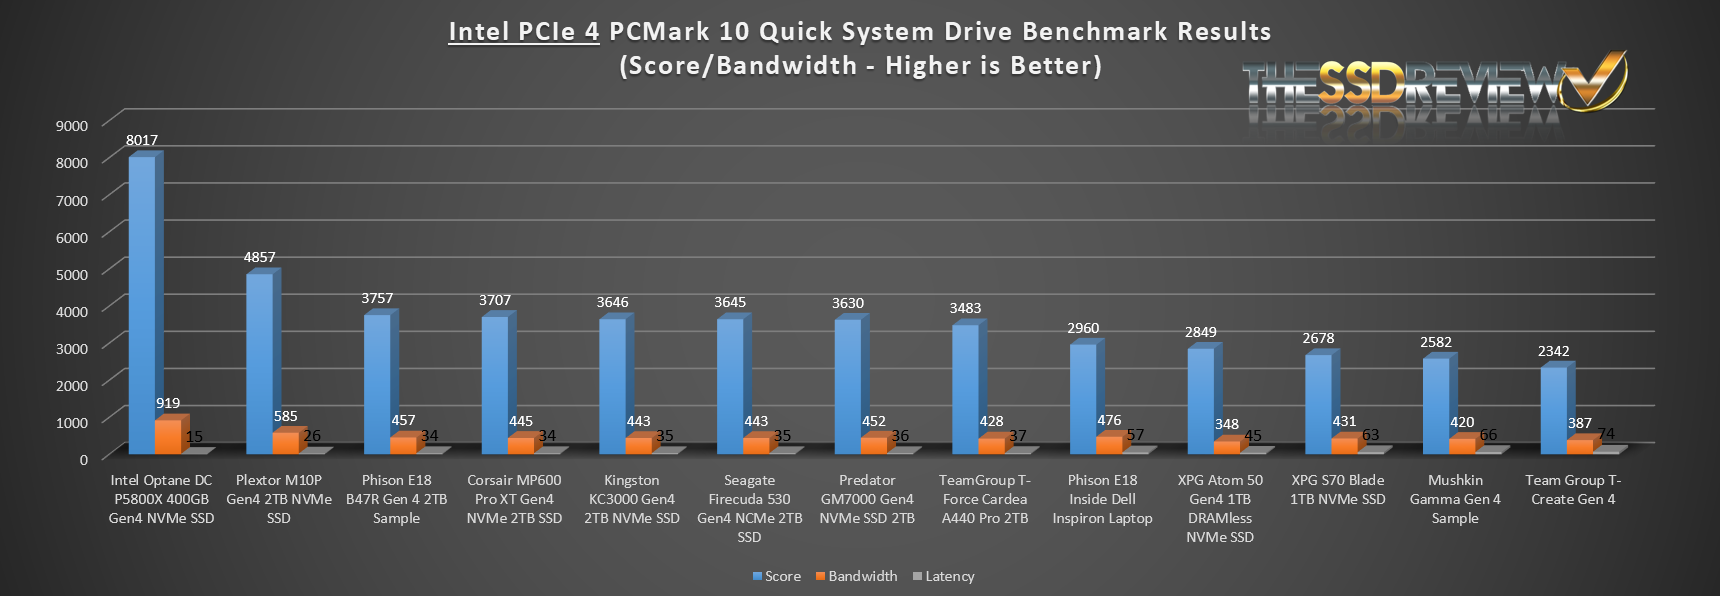
The Quick System Drive Benchmark is a subset of the Full test and is more representative of typical daily usage to show what would be expected regarding hybrid SSD performance on a day-to-day basis.
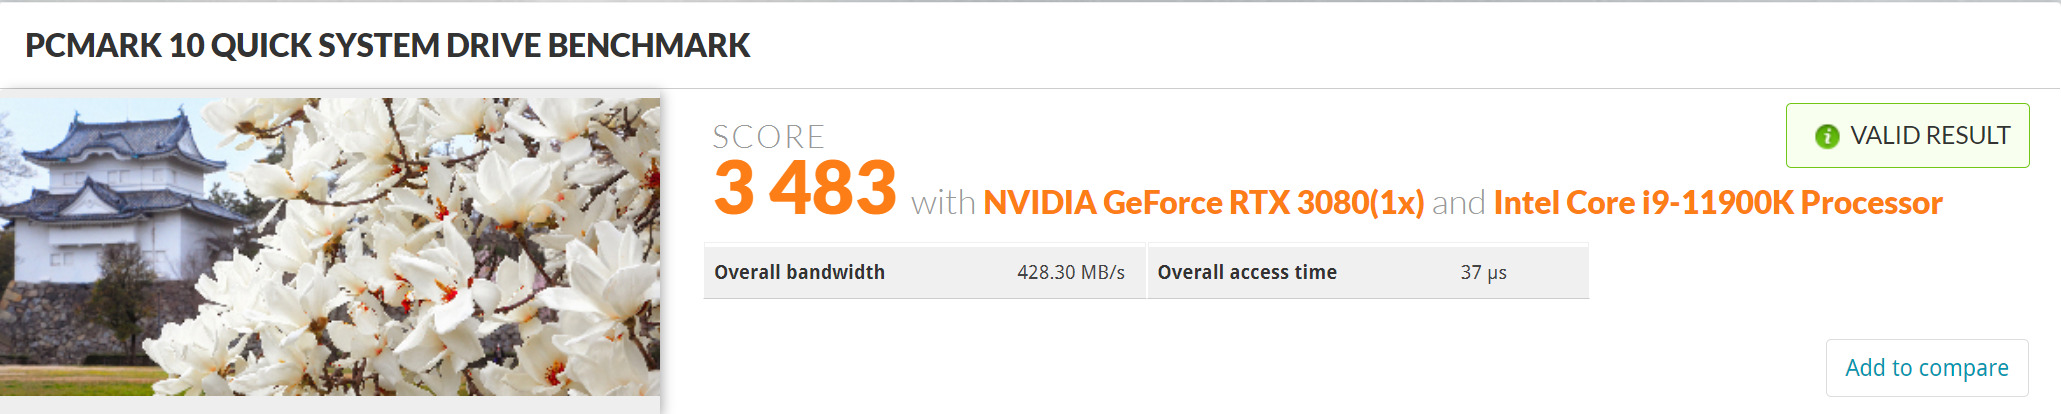
The Kingston KC3000 sits right beside all similar component SSDs as might be expected.
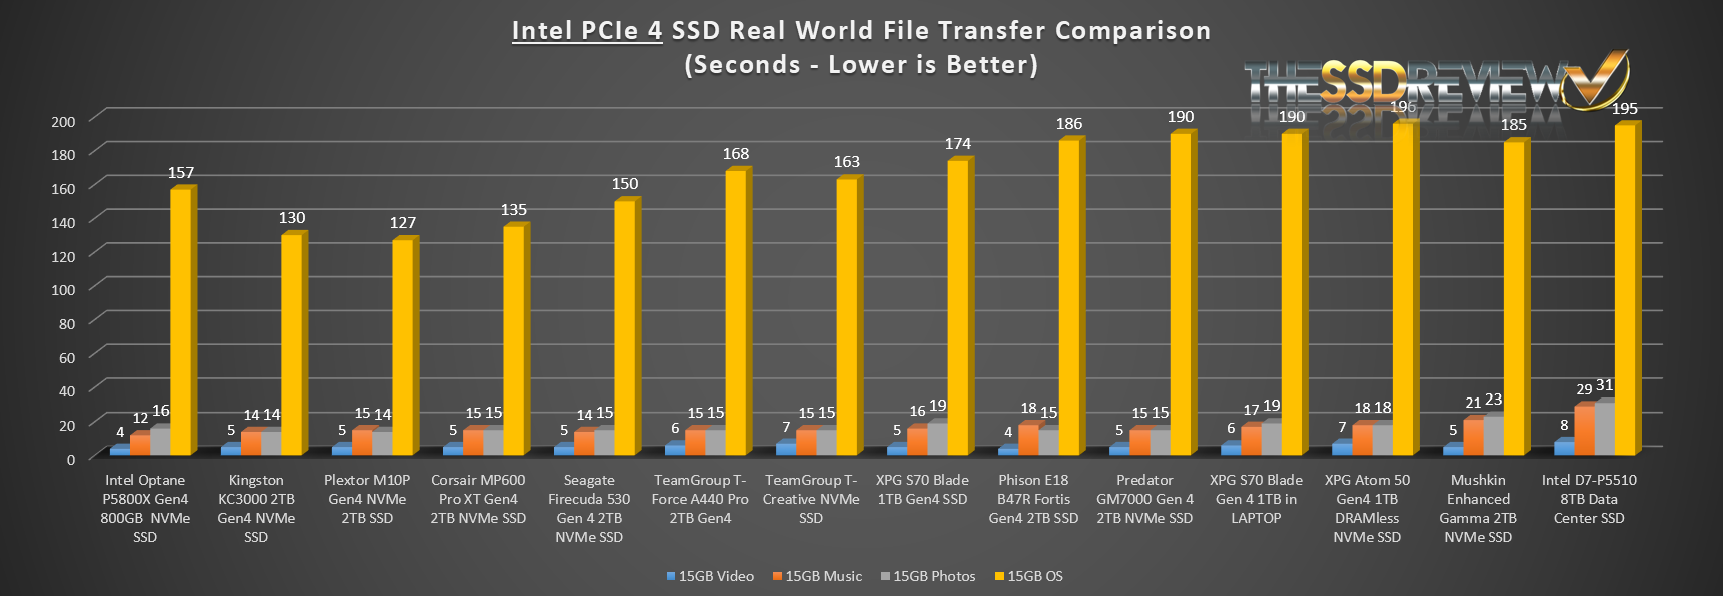
TRUE DATA TESTING
For our True Data Testing, we simply loaded 15GB video, music, photo and OS files onto the TeamGroup A440 Pro Gen 4 NVMe SSD and copied the data to a new folder on that same disk.
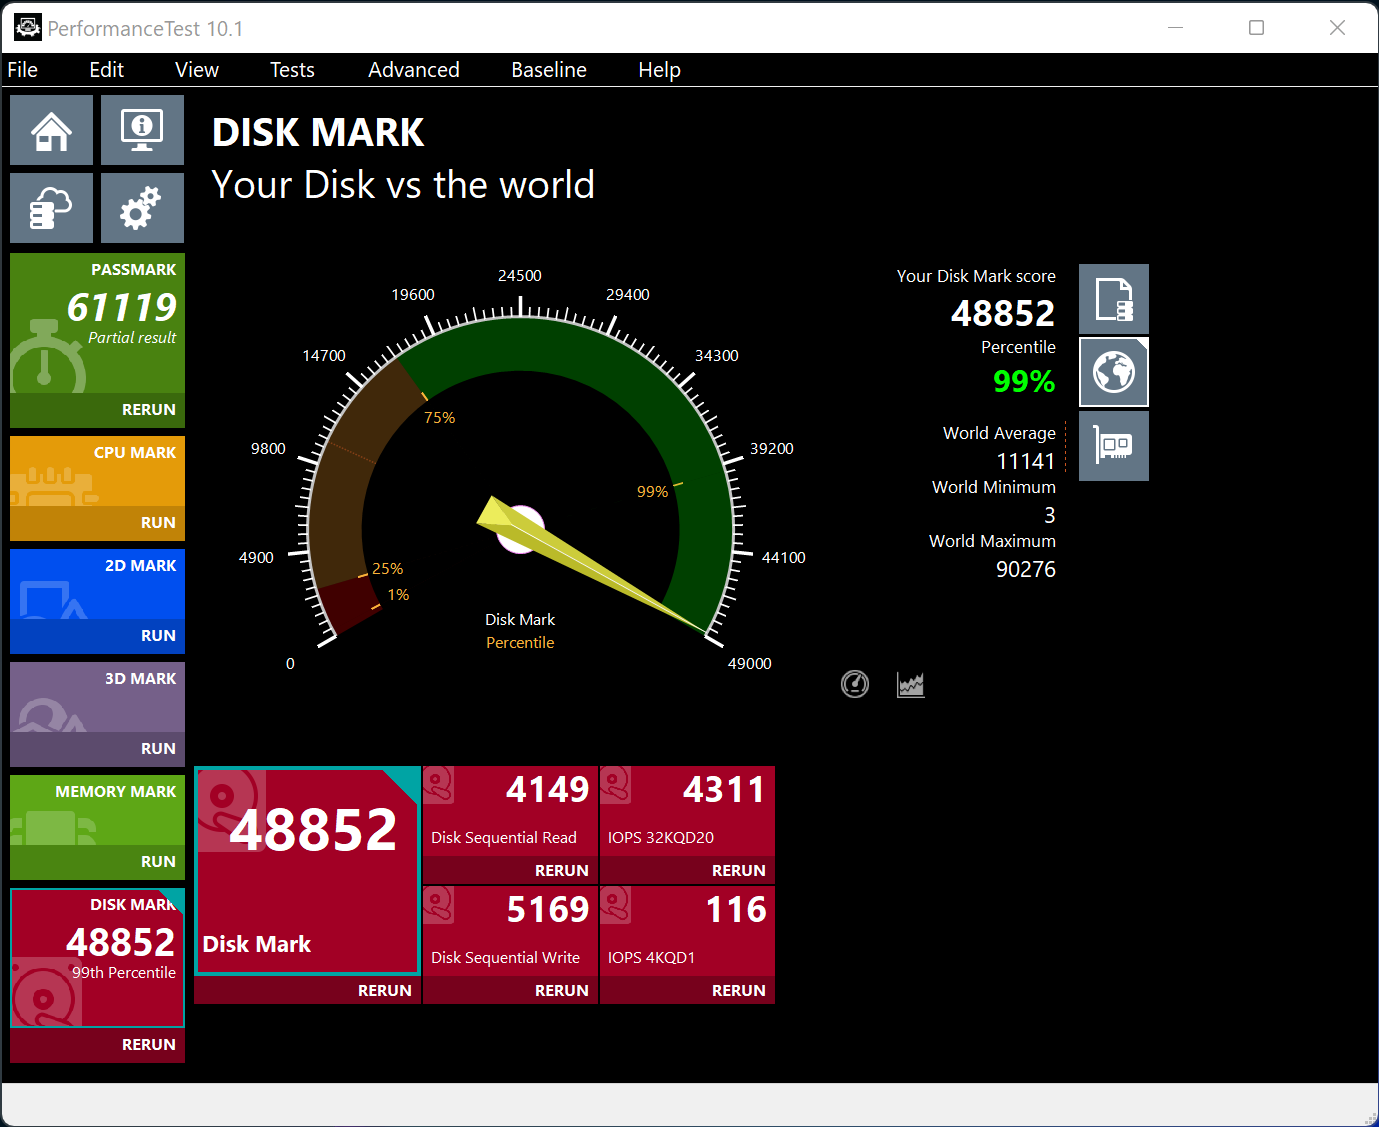
PASSMARK PERFORMANCE TEST
We thought we might add a few extras in our report today, PassMark Performance Test DiskMark component being a nice addition. This software tests sequential reads and writes, along with IOPS and compares the result with millions of other SSDs worldwide. We might suggest being in the 99th percentile of all SSDs tested was a nice result.
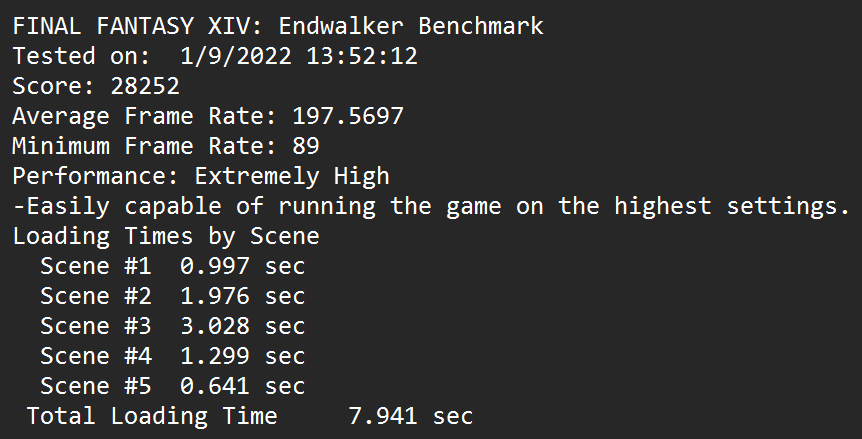
FINAL FANTASY XIV: ENDWALKER BENCHMARK
The Final Fantasy Benchmark is a new tool in our arsenal and geared specifically to the gamer. The software is installed directly on the SSD and the SSD tested, providing and end result of FPS and scene transition times.
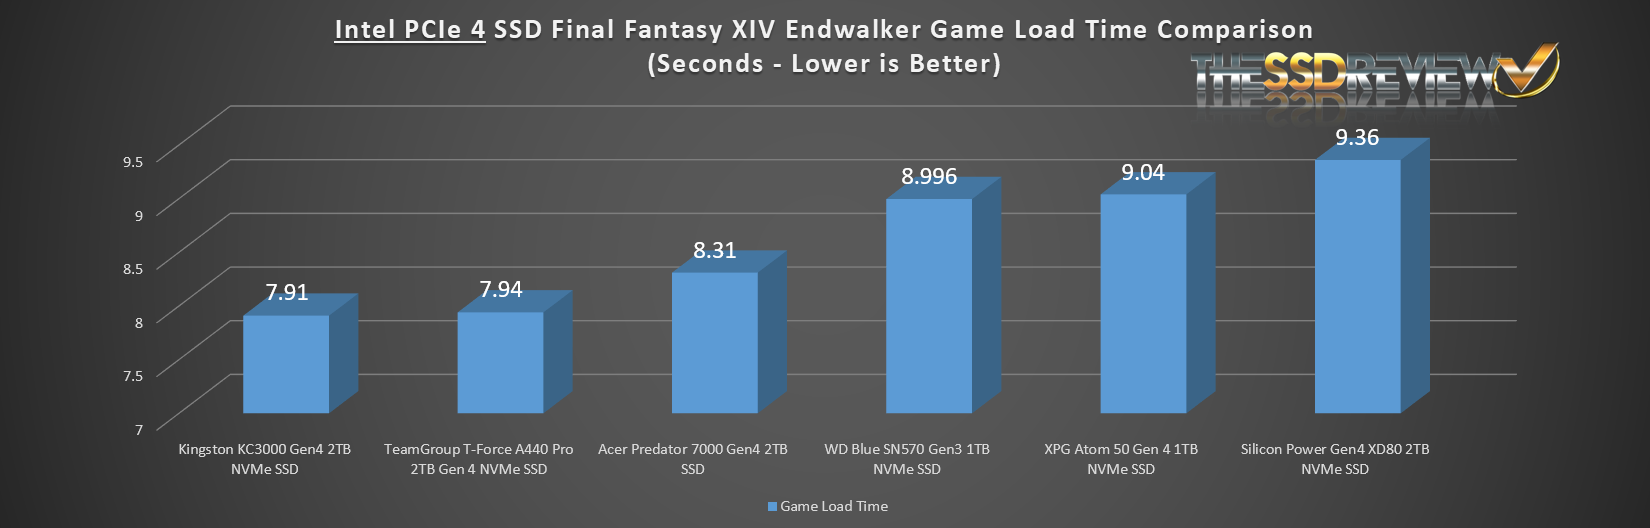
We thought it might be time to start displaying a bit of a comparison and, in doing this, we can see both the newest A440 Pro and Kingston SSDs have very quick loading times.
Page 2
“ATTO performance hits highs of 6.64GB/s read and 6.28GB/s write which are **up** great speeds for this ATTO benchmark.”
I don’t understand this grammar (see asterisked text).
Corrected and thank you for reading the report and p[roviding input.
Les
Thanks for test. Was quite for some time here.
Here is my suggestion I once mailed, but got no response 🙂
Could you testers please start to do more real life testing of programs, data transfers etc.?
There is zero benefit of all those benchmark programms, which do basically do the same.
Crystal Disk, Atto Disk, AS SSD, Anvil storage, Aja etc. are all redundant. You guys can keep 1 – 2 and it is enough.
All these benchmarks are like fillers – remove them and the test becomes 1 page only 😉
You guys have to make a decision between easy doable test but with little value and more complex and time consuming test but with more value and actual meaning for yourself and the readers.
The companies sending the samples do want sugarcoated benchmark-test only, showing optimised sequential tests only?
Especially a big and fast 2TB ssd like this, would benefit from some actual file tests of videos, data, slc-cache, fill rate, multiple write intensive programs simultaneously, and other details.
Thanks!