
TSSDR TEST BENCH AND PROTOCOL
SSD testing at TSSDR differs slightly, depending on whether we are looking at consumer or enterprise storage media. For our Patriot Viper PV593 Gen5 4TB SSD testing today, our goal is to test in a system that has been optimized optimized through standard BIOS selections (ie. XMP 3).
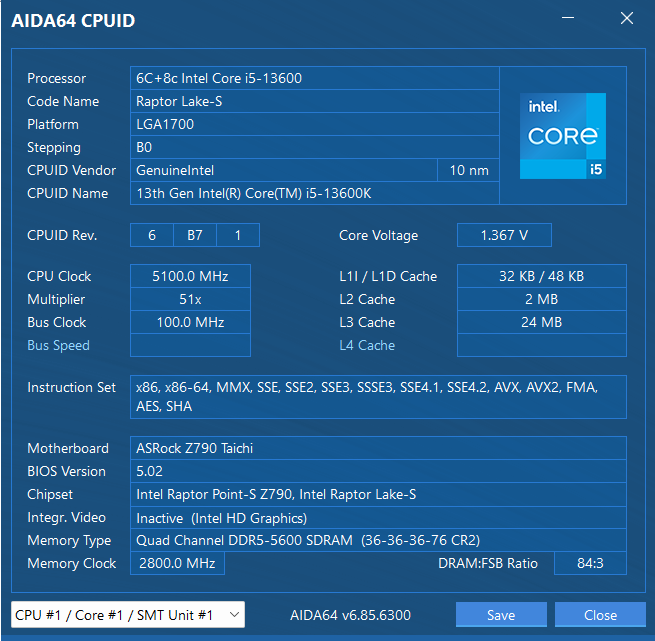
For this Test Bench, there are no ‘bios’ specific performance tweaks whatsoever and our new ASROCK Z790 Taichi brought Test Bench us to over 5GHz while the 32GB Corsair Dominator Platinum DDR5 memory settled in at 5600MHz.
The components of this Test Bench are detailed in the title link below. All hardware is linked for purchase and product sales may be reached by a simple click on the individual item.
ASROCK Z790 TAICHI PCIE 5.0 TEST BENCH COMPONENTS
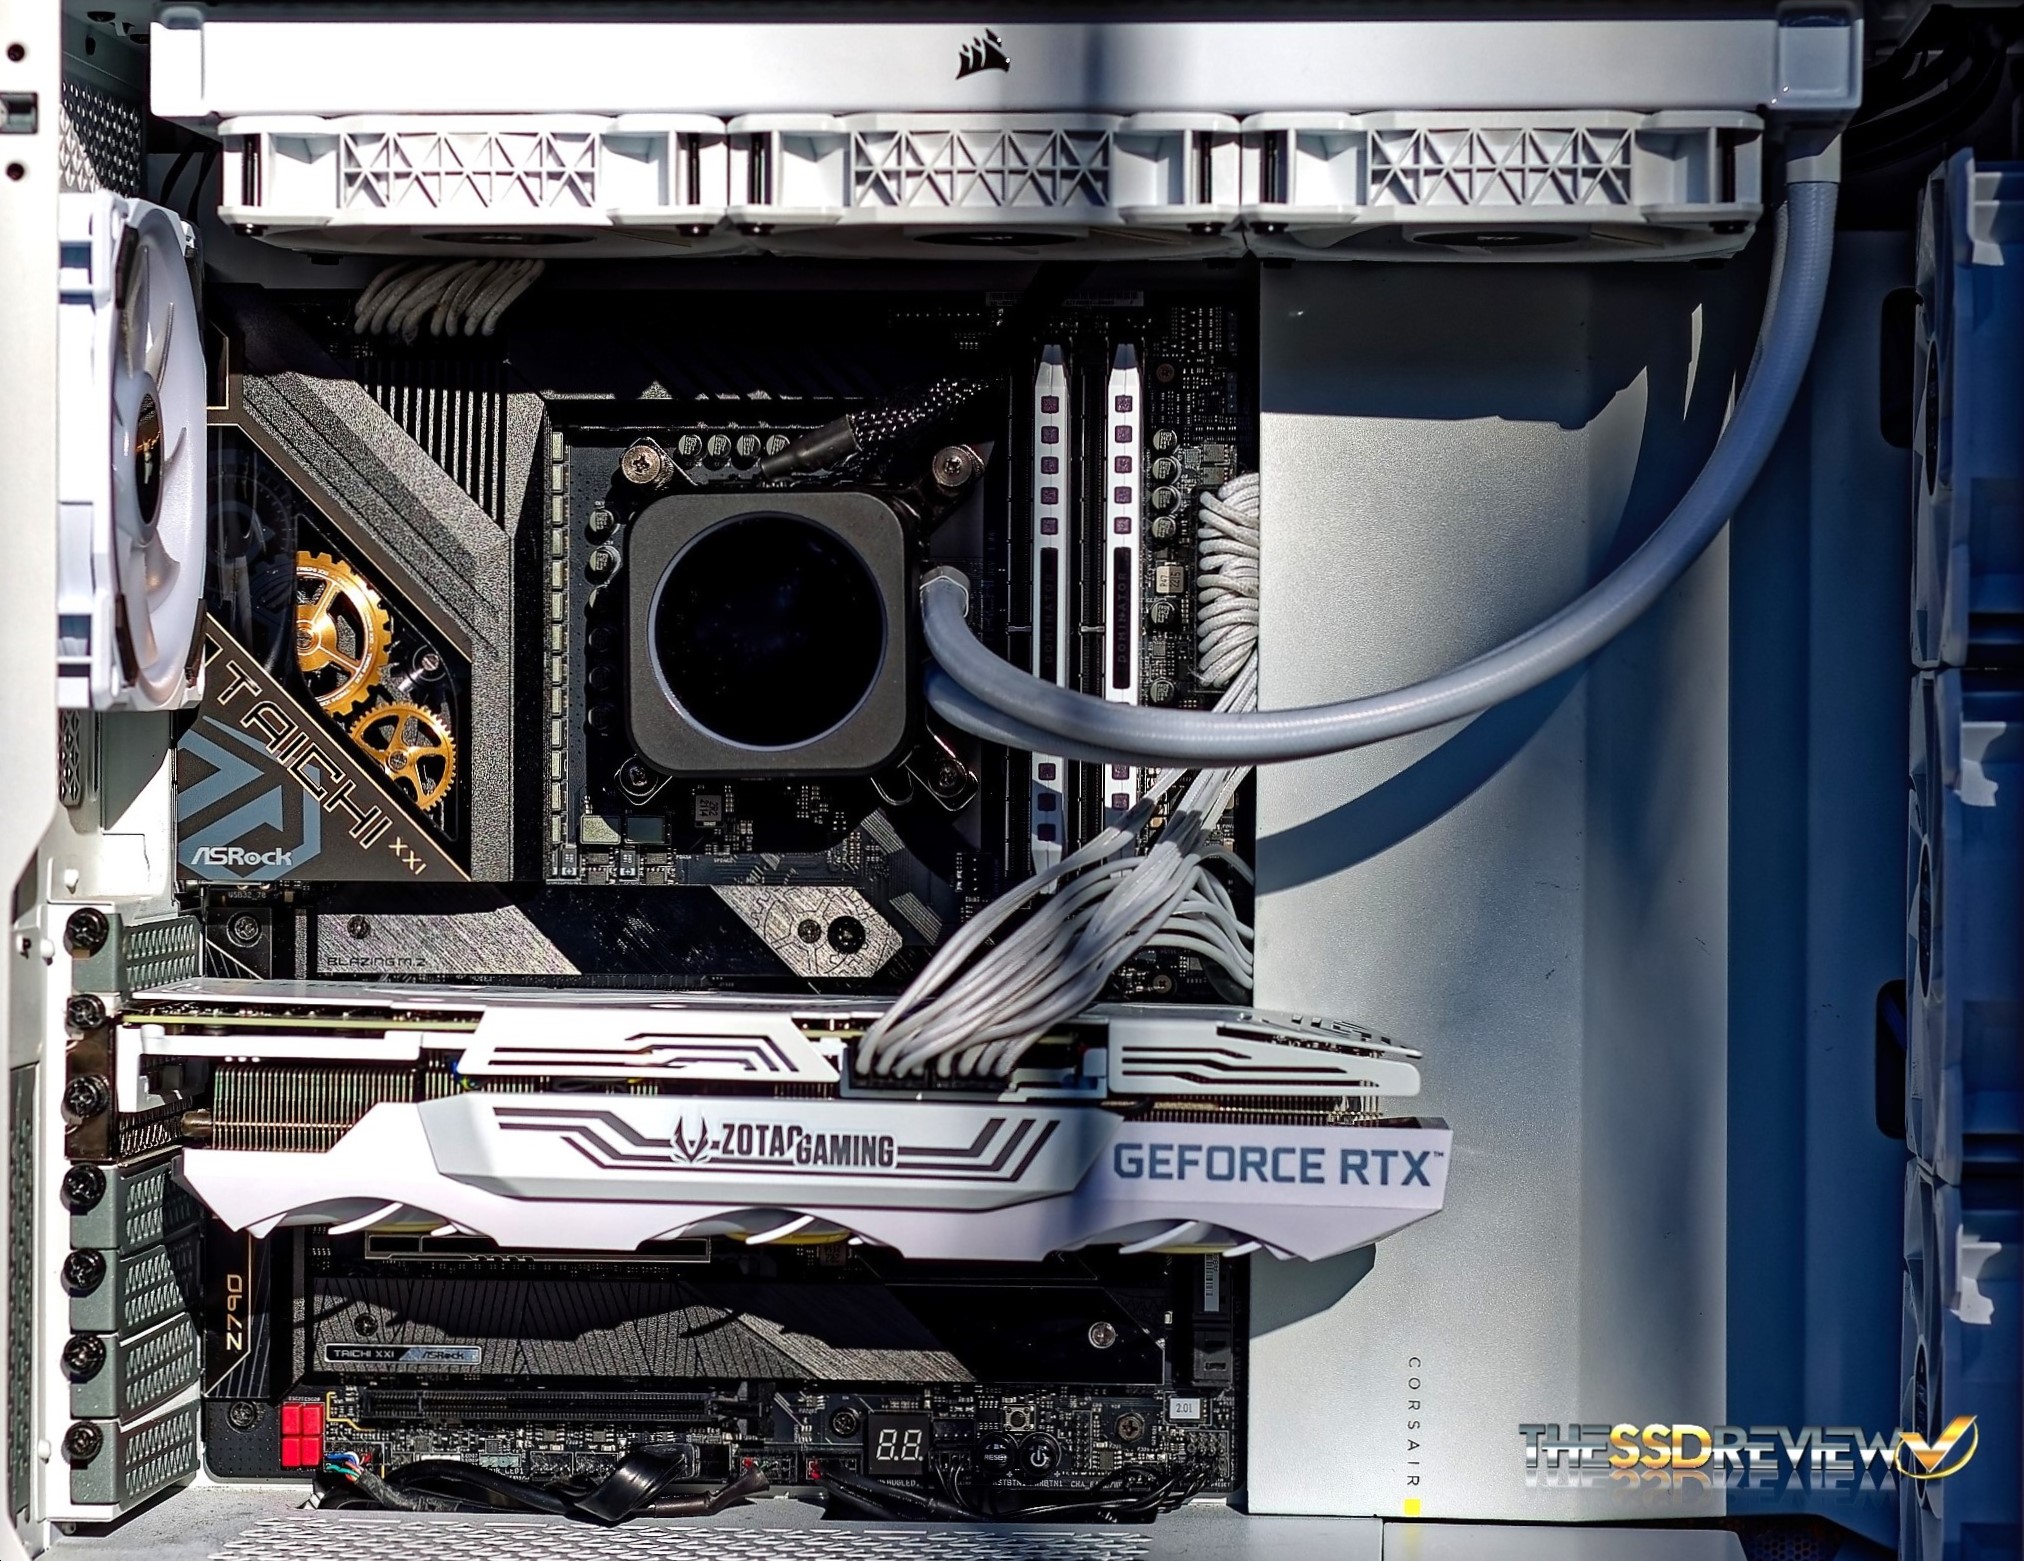
| PC CHASSIS: | Corsair 5000D RGB White Tempered Glass Chassis |
| MOTHERBOARD: | ASRock Z790 Taichi |
| CPU: | Intel 13th Gen Core i9-13900K |
| CPU COOLER: | Corsair Hydro Series H150i Capellix White |
| POWER SUPPLY: | Corsair HX1000i Platinum Modular 80Plus |
| GRAPHICS: | ZOTAC GeForce RTX 3080 Trinity White |
| MEMORY: | Corsair Dominator Platinum RGB DDR5-5600 |
| STORAGE: | Sabrent Rocket 4 Plus Gen 4 4TB NVMe SSD |
| KEYBOARD: | Corsair K70 PRO RGB Optical Mechanical Gaming |
| MOUSE: | Corsair M65 RGB Elite FPS Gaming |
| MONITOR: | Samsung 34 Inch 1440p WQHD Ultrawide Gaming |
BENCHMARK SOFTWARE
The software in use for today’s analysis is typical of many of our reviews and consists of Crystal Disk Info, ATTO Disk Benchmark, Crystal Disk Mark, AS SSD, Anvil’s Storage Utilities, AJA, TxBench, PCMark 10, 3DMark, Final Fantasy XIV Gaming BenchMark, as well as true data testing. Our selection of software allows each to build on the last and to provide validation to results already obtained.
A WORD ABOUT PERFORMANCE AND BUILDS
We have recently updated to our latest Ultra 200 Series Z890 Test Bench, however, we are finding that performance is best from our Z790 Test Bench in use for this report. Our goal is to inform our readers of the best performance possible from SSDs. Having said that, SSD performance can be a toss up when deciding on which CPU to test with. AMD CPU’s will give you the best high sequential performance, whereas Intel CPUs will provide the best low random performance. We have favoured Intel benches for some time and this report is with an Intel test Bench.
Upgrading Test benches every two years on average may also cause a performance increase in testing which we will identify in our comparison charts until there are enough Gen 5 reviews to move them to their own chart. Our view is simply that we want to provide the reader with the best possible performance and we welcome all to refer back to specific reports in order to identify the system in use should they desire. Logically, we simply haven’t the time to retest hundreds of SSDs every time we move up to a new platform. Thank you for understanding.
CRYSTAL DISK INFO VER. 8.17.7 X64
Crystal Disk Info is a great tool for displaying the characteristics and health of storage devices. It displays everything from temperatures, the number of hours the device has been powered, and even to the extent of informing you of the firmware of the device.
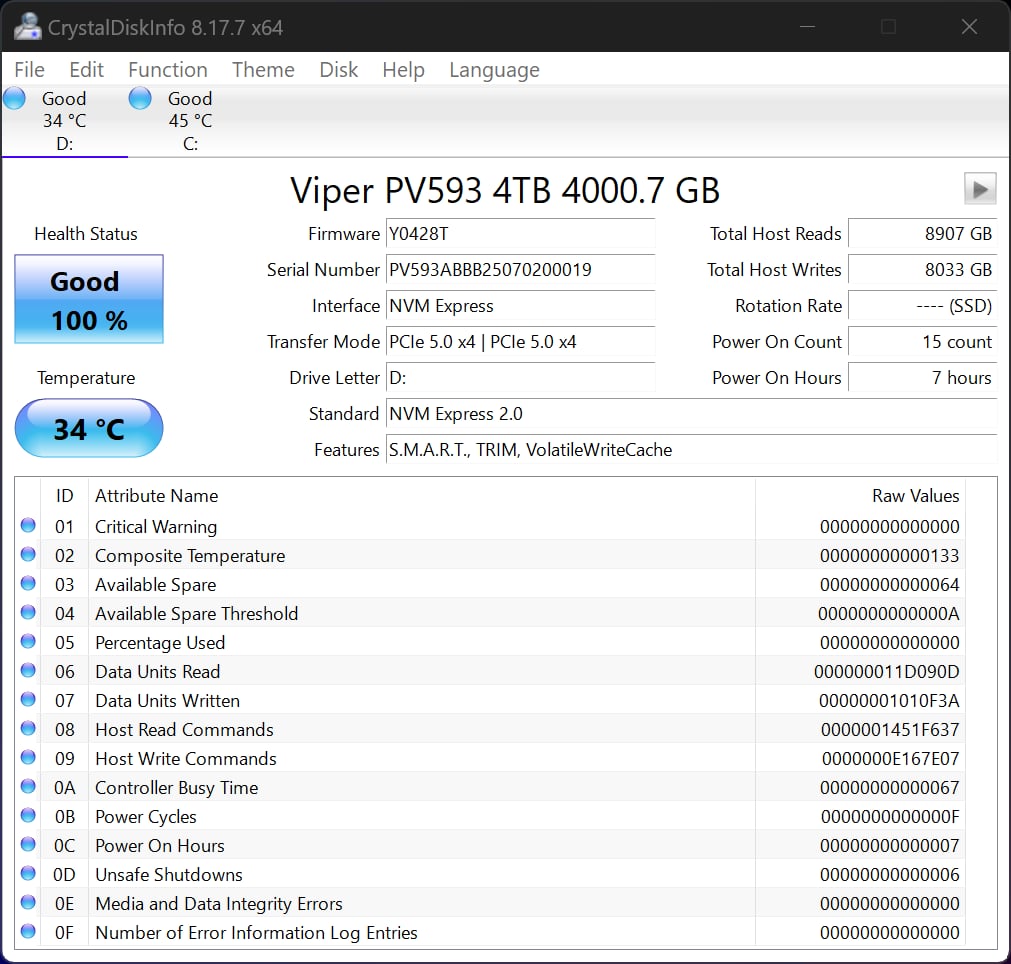
Crystal DiskInfo validates that our SSD is running in PCIe 5.0 x4, using the NVMe 2.0 protocol and confirms that it is TRIM capable.
ATTO Disk Benchmark is perhaps one of the oldest benchmarks going and is definitely the main staple for manufacturer performance specifications. ATTO uses RAW or compressible data and, for our benchmarks, we use a set length of 256mb and test both the read and write performance of various transfer sizes ranging from 0.5 to 8192kb. Manufacturers prefer this method of testing as it deals with raw (compressible) data rather than random (includes incompressible data) which, although more realistic, results in lower performance results.
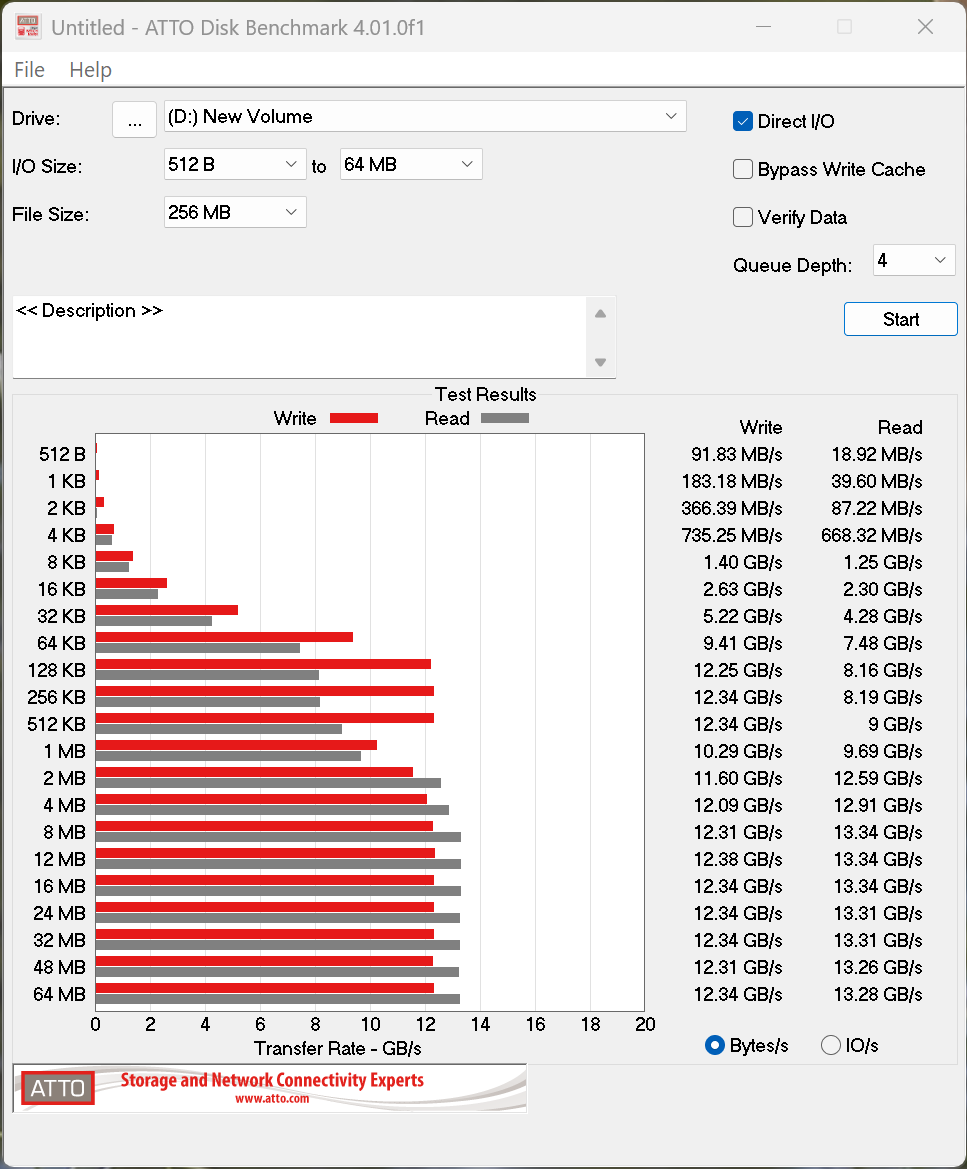
ATTO performance hits highs of 13.34GB/s read and 12.38GB/s write which is below listed specs as is the norm for ATTO.