
TSSDR INTEL XEON ASUS PRO WS W790E-SAGE SE TEST BENCH
This PCIe 5.0 test bench utilizes a custom benchmarking script originally developed by Allyn Malventano and generously shared by Jon Coulter of TweakTown. Designed to evaluate all aspects of enterprise SSD performance, the test suite runs on the Ubuntu Linux distribution. It includes comprehensive measurements such as 128K read/write throughput with latency, 4K and 8K read/write IOPS with latency, and mixed 4K workloads (70/30 and 50/50) with latency. All tests are conducted in steady-state conditions, and the final report includes a total of twenty performance charts.
![]()
During test bench setup, the motherboard BIOS was updated to the latest version, with the only modification being the disabling of hyper-threading. This adjustment is made specifically for single-core, CPU-intensive workloads, where the OS scheduler can mismanage threads and negatively impact performance.
The components of this Test Bench are detailed in the title link below. All hardware is linked for purchase and product sales may be reached by a simple click on the individual item. Click on the Title below to and be taken to our entire Workstation Build Report.
INTEL XEON 2595X ASUS PRO W790E-SAGE SE COMPONENTS
| PC CHASSIS: | PrimoChill Praxis Open Air Test Bench |
| MOTHERBOARD: | ASUS Pro WS W790E-Sage SE Workstation |
| CPU: | Intel Xeon w7-2595X 26-Core 2.8 GHz |
| CPU COOLER: | Silverstone XE360-4677 Liquid Cooler |
| POWER SUPPLY: | Corsair HX1200i (2025) Modular ATX |
| GRAPHICS: | Asus NVIDIA GeForce RTX 3050 6GB OC Edition |
| MEMORY: | Corsair WS DDR5-6000 ECC 64GB CL40 |
| KEYBOARD: | Corsair K100 Air Wireless RGB Mechanical |
| MOUSE: | Corsair Dark Core RGB Pro Wireless |
| MONITOR: | Samsung 34 Inch 1440p WQHD Ultrawide Gaming |
Building a workstation such as this isn’t possible without some great sponsorship. We would lke to thank Intel for sending along their Xeon W7-2595X 26-Core Workstation Processor, ASUS for their Pro WS W790E-SAGE SE Gen5 Workstation motherboard, Corsair for providing their W5 DDR5 ECC RDIM 64GB DDR5 DRAM 6000MT/s CL40 Memory Kit, along with their HX1200i High Performance Platinum ATX Power Supply, and Silverstone for sponsoring our build with their XE360-4677 HP Triple 120mm All-In-One Cooler for IIntel LGA4677.
TSSDR TEST REGIMEN
Testing at The SSD Review strictly adheres to industry accepted enterprise solid state storage testing procedures. All testing conducted follows and repeats the following pattern:
-
- Secure Erase SSD
- Write the full SSD twice with 128K sequential data
- Precondition the SSD by filling its volume with 4/8K random writes twice.
- Run each workload with a 30-second ramp for five minutes at each Queue Depth.
Before the rise of AI workloads, datacenter SSDs typically operated at relatively low queue depths, rarely exceeding QD32 because traditional enterprise applications didn’t demand extreme levels of parallelism. With modern AI data pipelines being orchestrated by GPUs, storage systems are now required to handle significantly higher input/output (I/O) loads. These workloads often generate queue depths in the thousands, especially during training or large-scale inference, where data must be fed to GPUs at extremely high speeds to avoid bottlenecks.
To better reflect these evolving demands, we’ve updated our test environment, including hardware, software, and methodology. Our performance testing now includes much higher queue depths, with the upper range expanded from QD256 to QD4096 for random I/O workloads, and up to QD1024 for sequential workloads. These changes ensure our benchmarks more accurately represent real-world performance under AI-driven datacenter conditions.
BENCHMARKS SEQUENTIAL
128K SEQUENTIAL WRITE/READ
To ensure consistent and reliable results, we precondition our enterprise SSDs using 100% sequential 128K writes at a queue depth of 256, utilizing a single thread across two full drive fills. Performance metrics are recorded every second throughout this process. This data allows us to closely monitor the SSD’s transition into steady-state—a critical condition for accurate benchmarking.
Steady-state is confirmed once a full drive fill has completed and performance levels off. At this point, the average 128K sequential write performance stabilizes at approximately 10.3 GB/s for the 1.6TB capacity and 10.4GB/s for the 800GB version of the X200Z, providing a consistent baseline before we begin our queue depth testing.
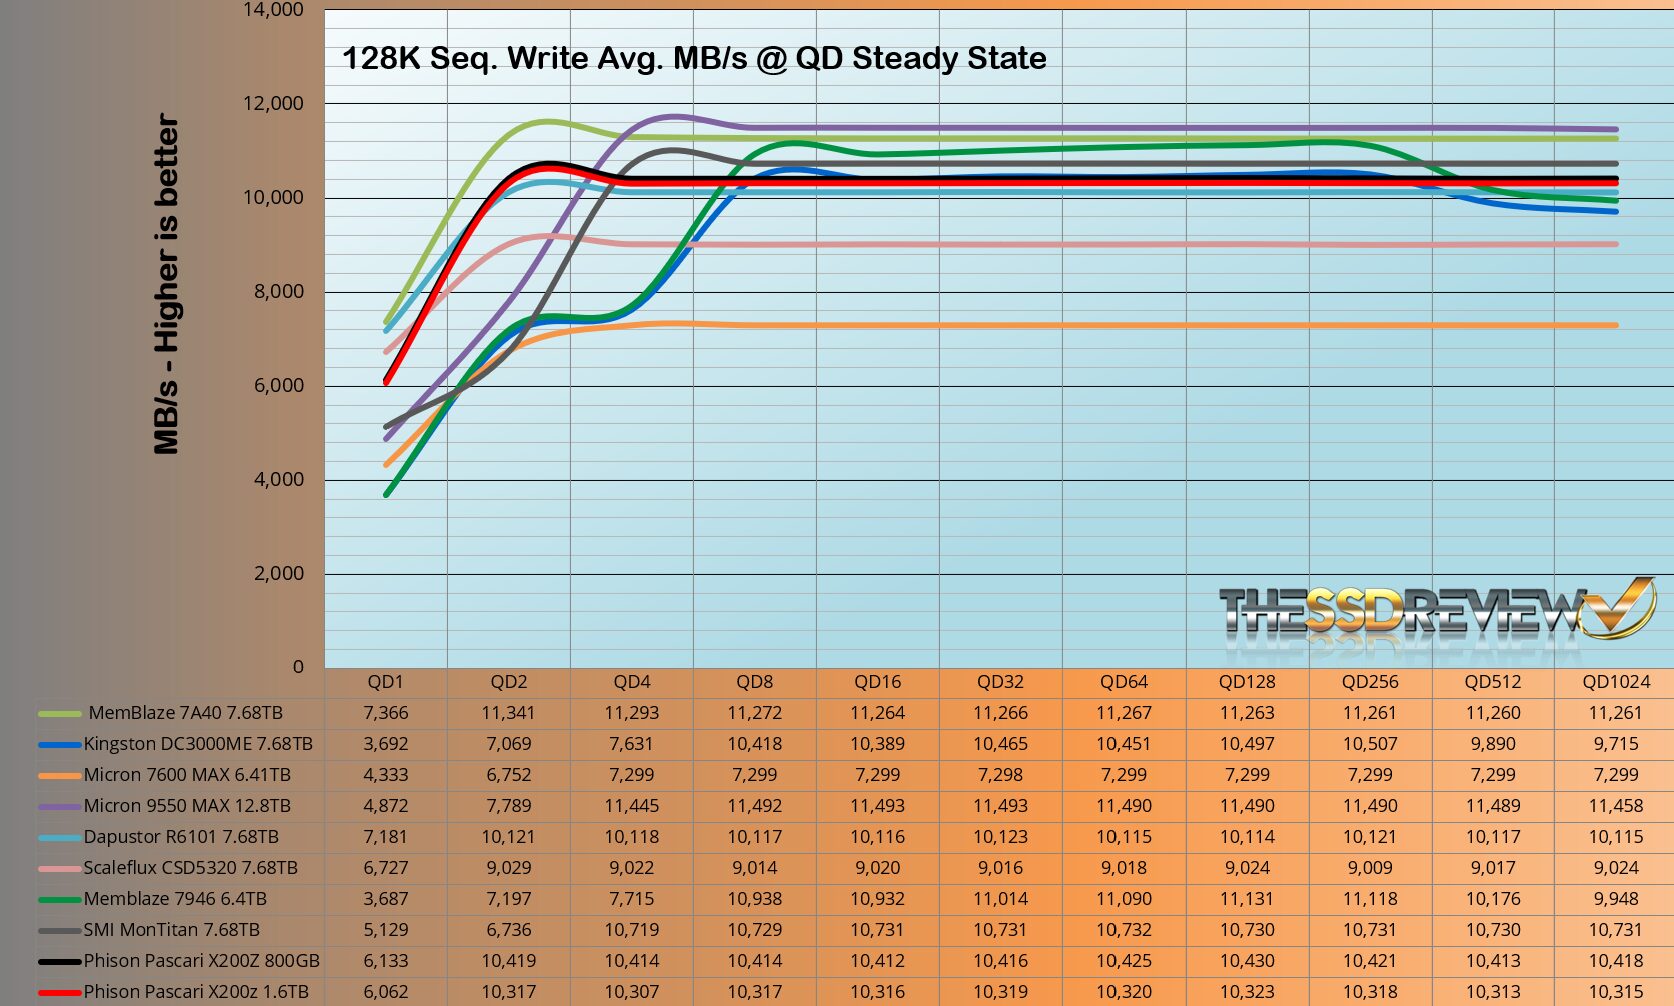
Listed specification for both capacities of the the Phison Pascari X200Z Gen5 U.2 SSD is 9.5GB/s 128K sequential write throughput and our testing provided an average of 10.4GB/s for the 800GB capacity and 10.3GB/s for the 1.6TB capacity. It should be acknowledged that the performance curve of both SSDs is perfectly flat from QD4 to QD1024.
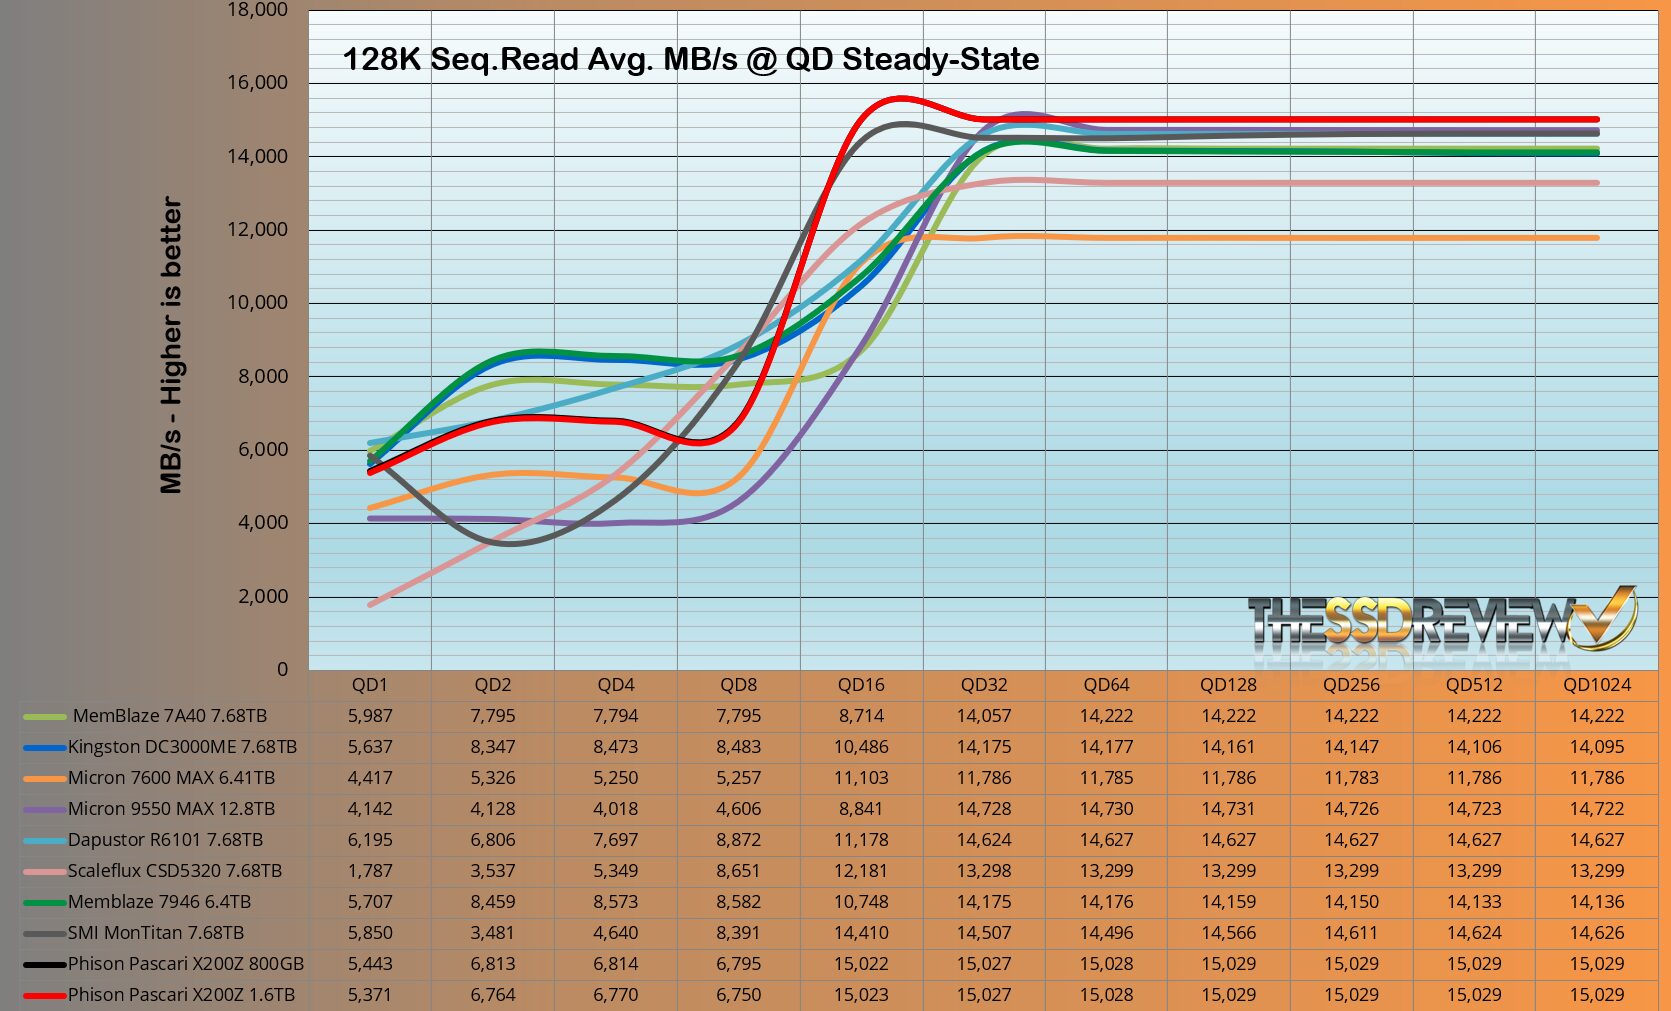
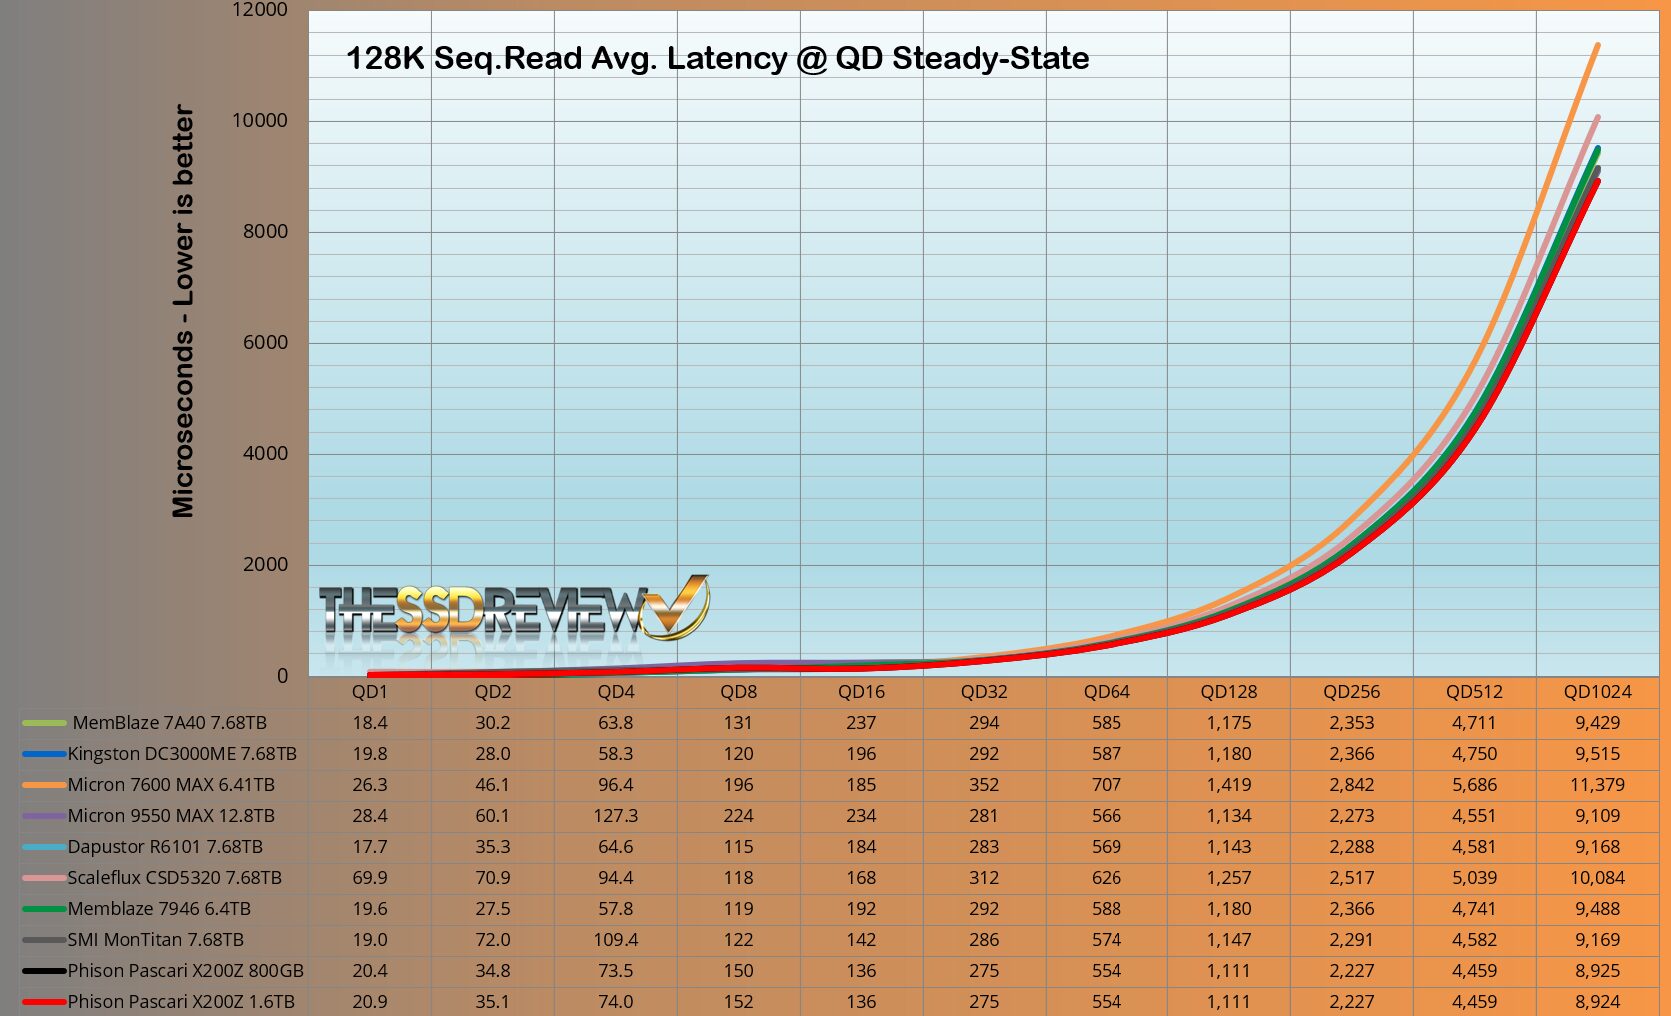
Our test resulted in an average 15GB/s read throughput, whereas the listed specification was 14.8GB/s. Full performance is achieved at QD32 where the performance results in a perfectly flat line until the test was complete. This is very nice to see with 15GB/s being the dead on speed through QDs 32, 64, 128, 256, 512 and 1024. This is the first we have ever seen of 15GB/s for Gen5 speeds!