
ATTO Disk Benchmark is perhaps one of the oldest benchmarks going and is definitely the main staple for manufacturer performance specifications. ATTO uses RAW or compressible data and, for our benchmarks, we use a set length of 256mb and test both the read and write performance of various transfer sizes ranging from 4kb to 84mb. Manufacturers prefer this method of testing as it deals with raw (compressible) data rather than random (includes incompressible data) which, although more realistic, results in lower performance results.
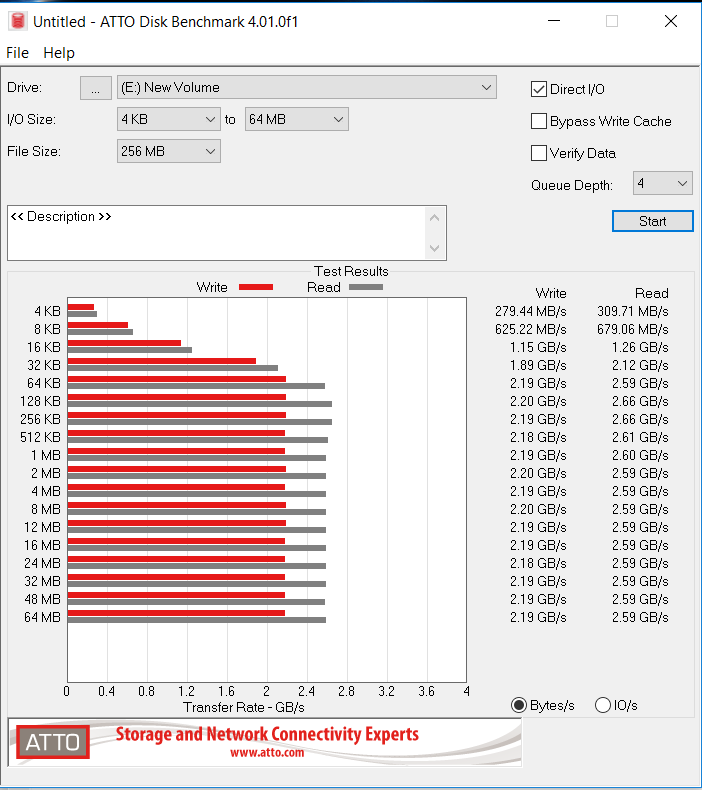
This is a very good start o testing. While advertised specifications list performance of 2.4GB/s read and 1.8GB/s write, these results are much higher at 2.6GB/s read and 2.1GB/s write.
CRYSTAL DISK BENCHMARK VER. 7.0.0 X64
Crystal Disk Benchmark is used to measure read and write performance through sampling of random data which is, for the most part, incompressible. Performance is virtually identical, regardless of data sample so we have included only that using random data samples.
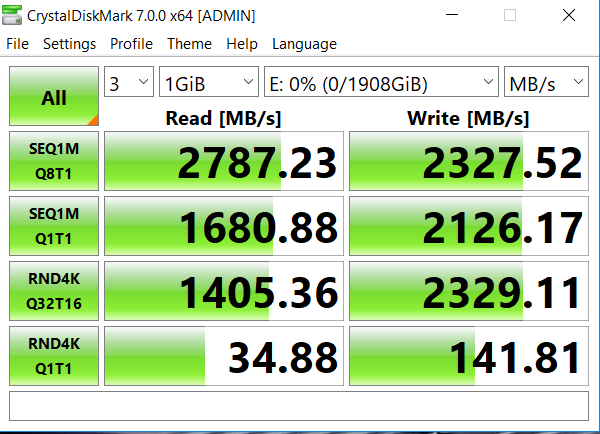
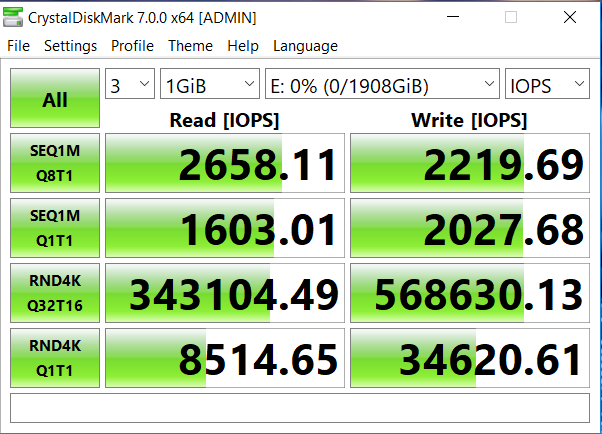
2.8GB/s read is the highest result we might see with ThunderBolt 3 and 2.3GB/s write is write on spec. These are great results to see from a portable SSD, and well above listed specifications. With this newest version of Crystal Diskmark, we can also see that this SSD is hitting a high of 568K IOPS.
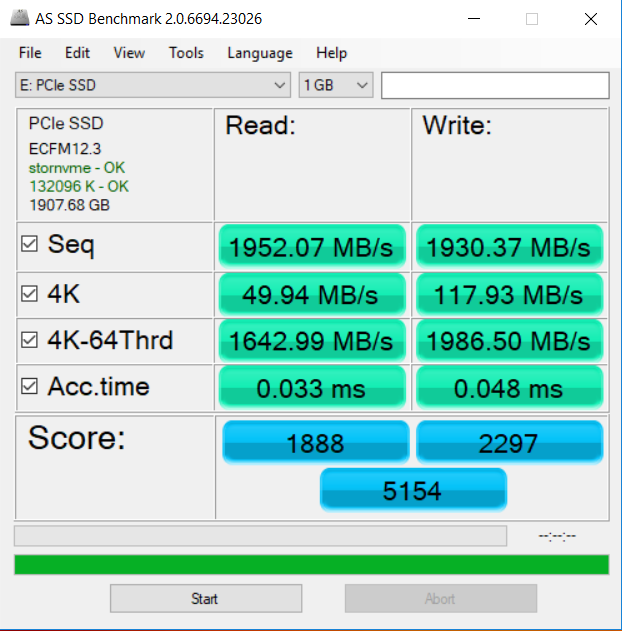
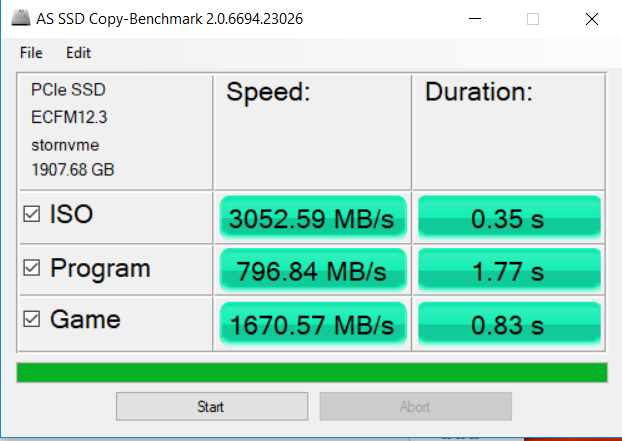
The toughest benchmark available for solid state drives is AS SSD as it relies solely on incompressible data samples when testing performance. For the most part, AS SSD tests can be considered the ‘worst case scenario’ in obtaining data transfer speeds and many enthusiasts like AS SSD for their needs. Transfer speeds are displayed on the left with IOPS results on the right.

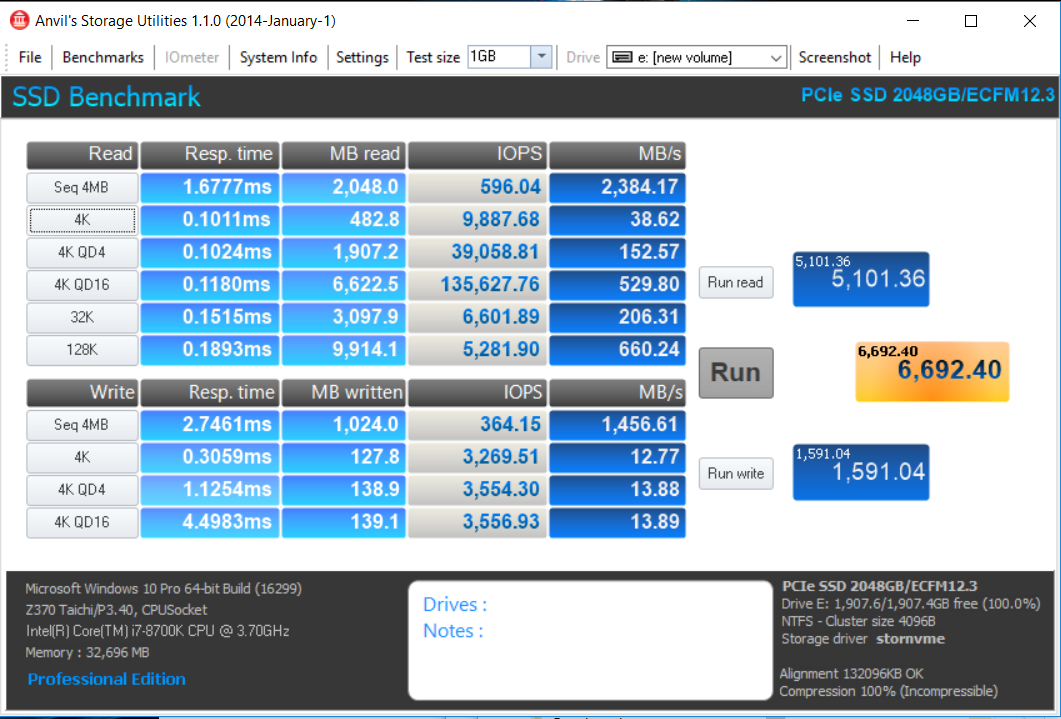
ANVIL STORAGE UTILITIES PROFESSIONAL
Anvil’s Storage Utilities (ASU) are the most complete test bed available for the solid state drive today. The benchmark displays test results for, not only throughput but also, IOPS and Disk Access Times. Not only does it have a preset SSD benchmark, but also, it has included such things as endurance testing and threaded I/O read, write and mixed tests, all of which are very simple to understand and use in our benchmark testing.
I’m starting to wonder how hard it would be to drop in a Titan Ridge vs. an Alpine Ridge controller. It seems any additional cost would easily be passed to the consumer, as the new device is TB3 with USB3 fallback.
Can you include testing these external TB3 devices after cold boot and hot plug?
Are the speeds identical or different in any way?
I get substantial differences between these two scenarios with the Samsung X5.
It is a given that the test speed would be different, the result of other background activity in the system, especially after a cold boot. We test during ideal conditions and I would be the first to write about it if the tests weren’t always consistent during these conditions. Yopu are also speaking on the X5 in a Plugable report? Are you finding same with this device?
Hi Les, I have performance variations of 3x between cold boot and hot plug with the Samsung 512GB X5 on Windows 10.
I understood this was because TB3 vendors have trouble with the re-negotiation of the Thunderbolt connection after hot plug.
The computer I used is a brand new HP Zbook Studio G5 with Samsung NVMe SSD boot drive running Windows 10 Pro update 1909.
Samsung 512GB X5 Magician benchmarks:
Benchmark #1: 2803/588/263427/25390 after disconnect/re-connect no G2 hub
Benchmark #2: 2806/1877/263427/251220 after cold boot, no G2 hub
Benchmark #3: 2818/589/261474/251220 after disconnect/re-connect with G2 hub
Benchmark #4: 2753/1386/259277/252192 after cold boot with G2 hub
Samsung Tech support confirmed that their tech support center has heard from customers experiencing the same issue.
I also found a lot of variation using TB3 add-in cards from ASUS (ThunderboltEX3), and Gigabyte (Alpine Ridge, Titan Ridge), which is why I wondered if you have tested or found differences in performance with hot plug, in which case it might be a useful test to add. I am definitely disappointed to need a cold boot to get best performance.
Now that you have switched to the ASRock X570 Creator as your test bed, I would like to know if the ASRock X570 motherboard TB3 implementations (Creator onboard TB3 and Taichi+PCI TB3 card) have reliably solved this issue.
Thanks for any help.