
REAL WORLD FILE TRANSFER – 2011 TO 2018
For our Real World File Transfer Comparison, we have included the Samsung 860 Pro 4TB 2.5″ SSD, Intel SSD5 545s, OWC Mercury Electra MAX 6G, SanDisk Cloudspeed ECO, Sandisk Extreme Pro, OWC Mercury Extreme Pro 6G, Intel 320 3Gbps SSD from 2011, in our testing with the Samsung 2TB 860 EVO M.2, SATA 3 SSD. This test is conducted through the transfer of data from one spot on the test drive to another to give us the truest of transfer speed results for that device.
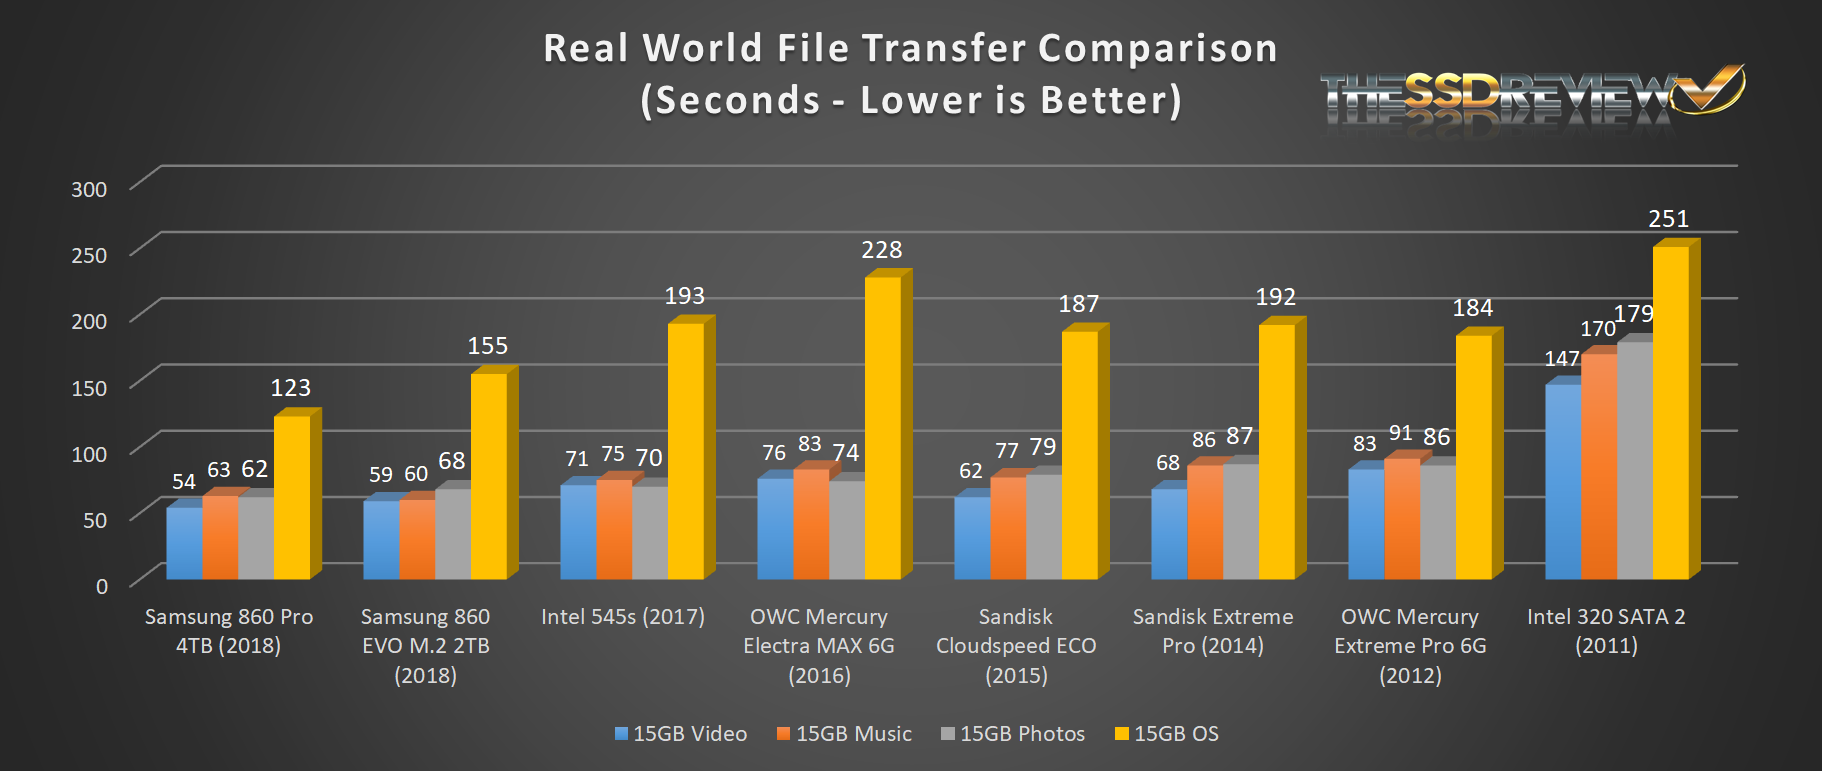
Our original idea was to pit the newest 860 EVO M.2 SSD against the newest 860 Pro 2.5″ 4TB SSD we just reviewed last month. In grabbing a few other SSDs from the pile, we thought that it might be a bit amusing graduating the SSDs through the years, starting back in 2011 with the Intel 320 SSD that we had on hand. It is great seeing a depiction of how performance improves over time while still focusing in on SATA SSDs.
PCMARK 8 EXTENDED STORAGE WORKLOAD CONSISTENCY TESTING
For our last benchmark, we have decided to use PCMark 8 Extended Storage Workload in order to determine steady state throughput of the SSD. This software is the longest in our battery of tests and takes just under 18 hours per SSD. As this is a specialized component of PCMark 8 Professional, its final result is void of any colorful graphs or charts typical of the normal online results and deciphering the resulting excel file into an easily understood result takes several more hours.
There are 18 phases of testing throughout the entire run, 8 runs of the Degradation Phase, 5 runs of the Steady State Phase and 5 runs of the Recovery Phase. In each phase, several performance tests are run of 10 different software programs; Adobe After Effects, Illustrator, InDesign, Photoshop Heavy and Photoshop Light, Microsoft Excel, PowerPoint and Word, as well as Battlefield 3 and World of Warcraft to cover the gaming element.
- PRECONDITIONING -The entire SSD is filled twice sequentially with random data of a 128KB file size. The second run accounts for overprovisioning that would have escaped the first;
- DEGRADATION PHASE – The SSD is hit with random writes of between 4KB and 1MB for 10 minutes and then a single pass performance test is done of each application. The cycle is repeated 8 times, and with each time, the duration of random writes increases by 5 minutes;
- STEADY STATE PHASE – The drive is hit with random writes of between 4KB and 1MB for 45 minutes before each application is put through a performance test. This process is repeated 5 times;
- RECOVERY PHASE – The SSD is allowed to idle for 5 minutes before and between performance tests of all applications. This is repeated 5 times which accounts for garbage collection; and
- CLEANUP – The entire SSD is written with zero data at a write size of 128KB
In reading the results, the Degrade and Steady State phases represent heavy workload testing while the recovery phase represents typical consumer light workload testing.
As you can see, performance is recorded in terms of Bandwidth and Latency. Bandwidth (or throughput) represents the total throughput the drive is able to sustain during the tests during each phase. Latency, at least for the purposes of PCMark 8, takes on a different outlook and for this, we will term it ‘Total Storage Latency’. Typically, latency has been addressed as the time it takes for a command to be executed, or rather, the time from when the last command completed to the time that the next command started. This is shown below as ‘Average Latency’.
For a more in-depth look into Latency, Bandwidth, and IOPS check out our primer article on them here.
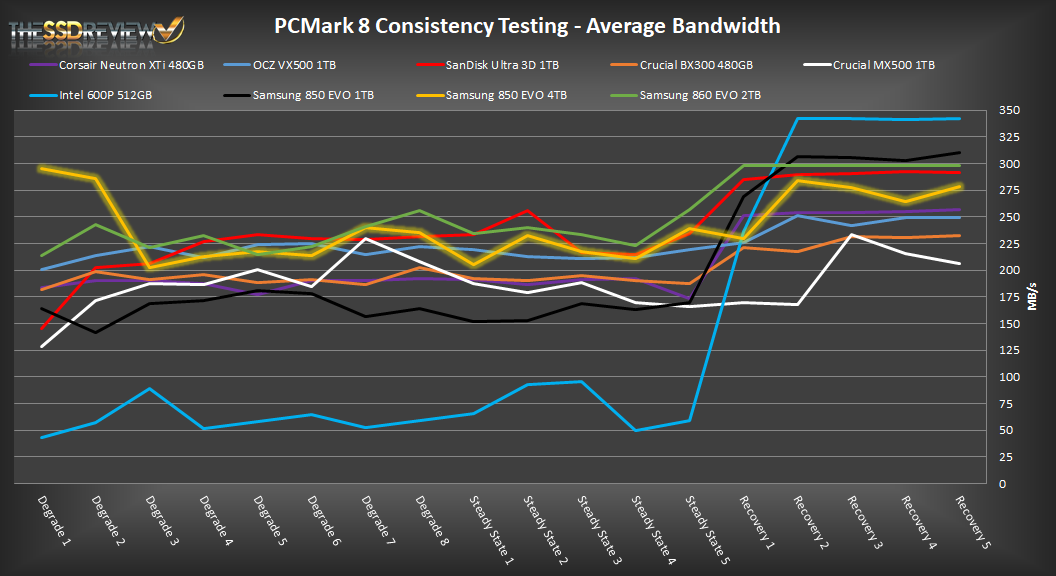
AVERAGE BANDWIDTH (OR THROUGHPUT)
These results show the total average bandwidth across all tests in the 18 phases. In this graph the higher the result the better.
AVERAGE LATENCY (OR ACCESS TIME)
These results show the average access time during the workloads across all tests in the 18 phases. In this graph the lower the result the better.
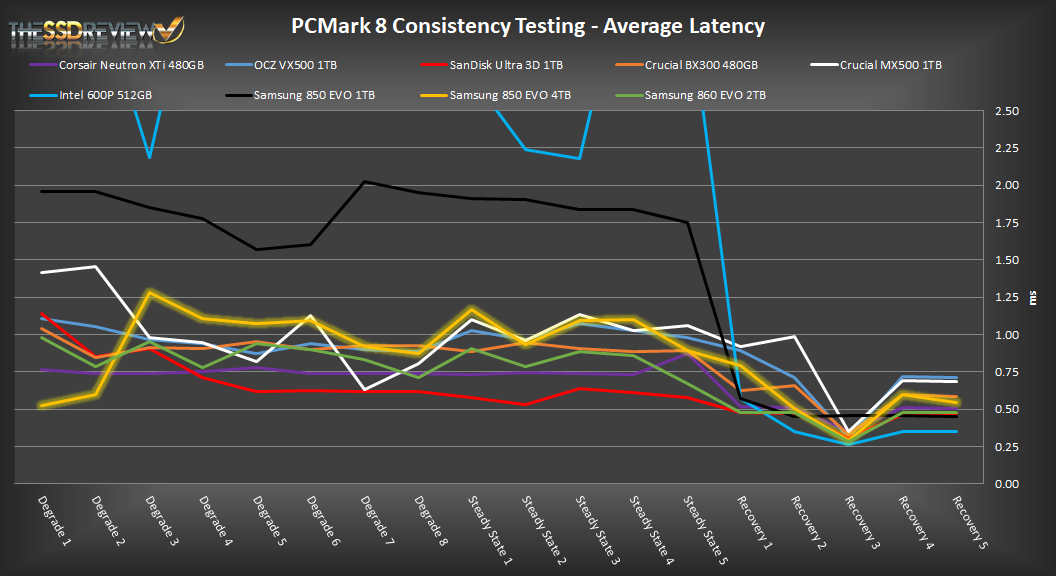
Perhaps rather surprisingly with respect to this SSDs standing in the original PCMark 8 Storage Benchmark, the Samsung 860 EVO 2TB M.2 SATA 3 SSD stood its ground here and placed right where we figured it should be. More specifically, there is solid ground that Samsung has improved upon its last generation 850 EVO.