
TSSDR TEST BENCH AND PROTOCOL
SSD testing at TSSDR differs slightly, depending on whether we are looking at consumer or enterprise storage media. For our WD Black SN750 1TB NVMe M.2 SSD testing today, our goal is to test in a system that has been optimized with our SSD Optimization Guide. To see the best performance possible, the CPU C states have been disabled, C1E support has been disabled, and Enhanced Intel SpeedStep Technology (EIST) has been disabled. Benchmarks for client testing are also benchmarks with a fresh drive so, not only can we verify that manufacturer specifications are in line but also, so those buying pre-built systems with the SN750 can replicate our tests to confirm that they have an SSD that is top-notch. We even provide links to most of the benchmarks used in the report.
SYSTEM COMPONENTS
The components of this Test Bench are detailed below. All hardware is linked for purchase and product sales may be reached by a simple click on the individual item. As well, the title is linked back to the individual build article where performance testing can be validated.
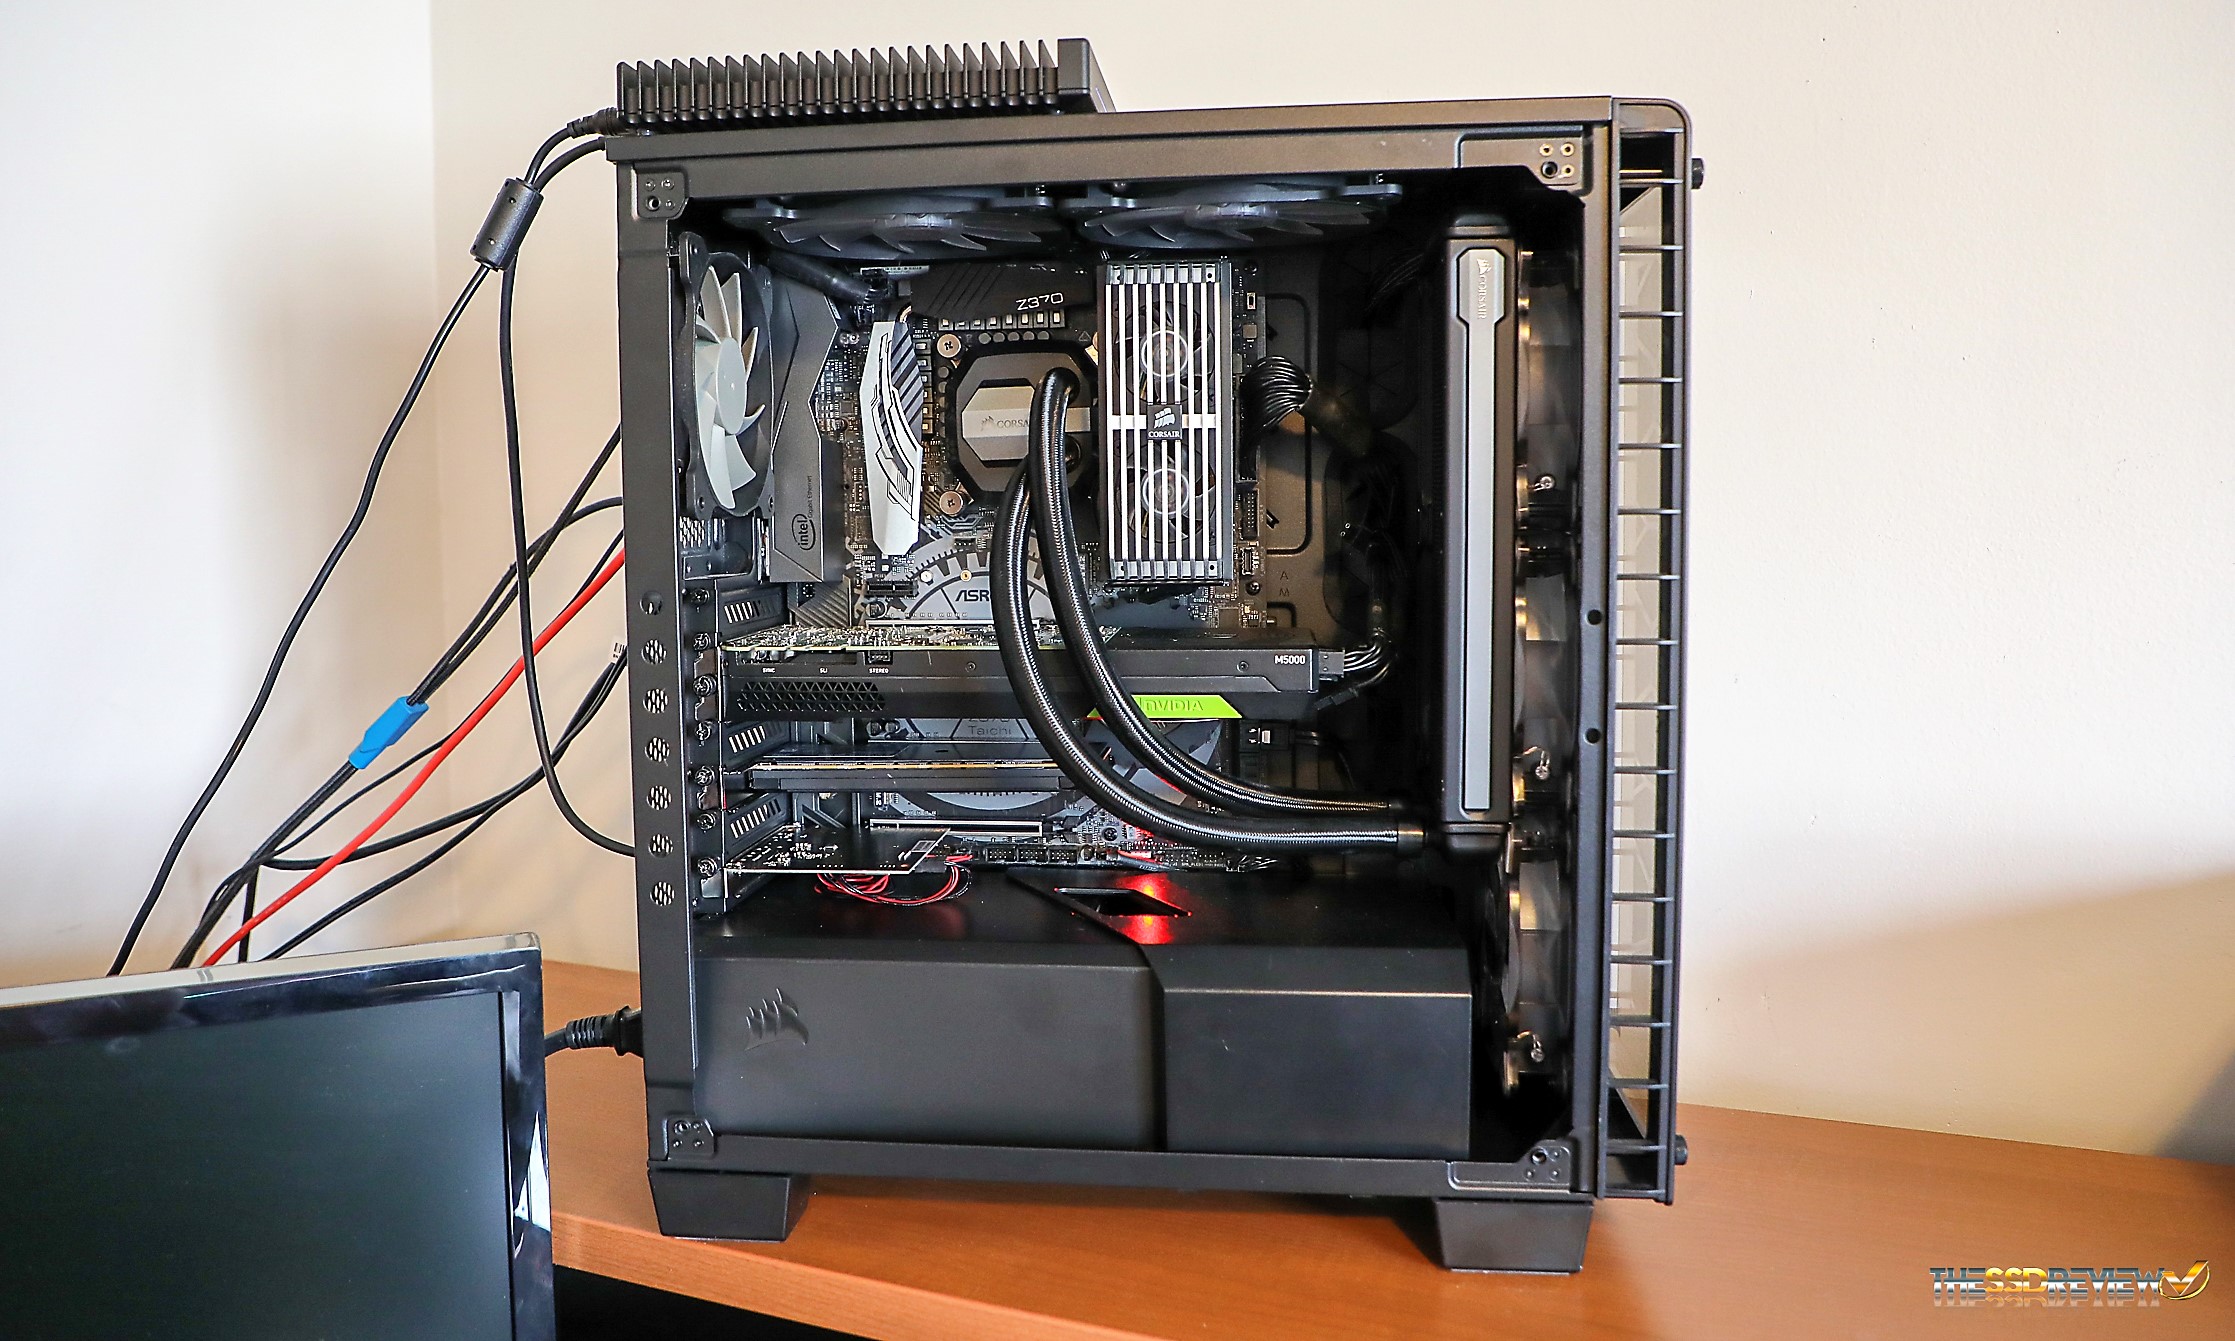
TSSDR ASROCK Z370 TAICHI TEST BENCH (link)
| PC CHASSIS: | Corsair Crystal Series 460X RGB |
| MOTHERBOARD: | ASRock Z370 Taichi |
| CPU: | Intel Coffee Lake Core i7-8770K |
| CPU COOLER: | Corsair Hydro Series H110i GTX |
| POWER SUPPLY: | Corsair RM850x 80Plus |
| GRAPHICS: | PNY GTX 1080 XLR8 Gaming OC |
| MEMORY: | Corsair Dominator Pl 32GB 2800 |
| STORAGE: | Intel Optane 900P 480GB SSD |
| KEYBOARD: | Corsair Strafe RGB Silent Gaming |
| MOUSE: | Corsair M65 Pro Gaming |
| OS | Microsoft Windows 10 Pro 64 Bit |
BENCHMARK SOFTWARE
The software in use for today’s analysis is typical of many of our reviews and consists of Crystal Disk Info, ATTO Disk Benchmark, Crystal Disk Mark, AS SSD, Anvil’s Storage Utilities, AJA, PCMark Vantage, TxBench, PCMark 8, as well as true data testing. Our selection of software allows each to build on the last and to provide validation to results already obtained.
As with many SSDs today, the WD Black SN750 has a free copy of their SSD Dashboard available for download (click the title). The Dashboard has had somewhat of a face lift and has a very attractive interface, allowing users to monitor SSD capacity, life, performance, update firmware, temperature and a number of other features.

Gamers will also notice that there is a ‘Gaming Mode’ switch on the front page. If you turn it on, it will require a system restart and disables your SSDs low power mode, keeping the SSD running at peak performance for longer periods.
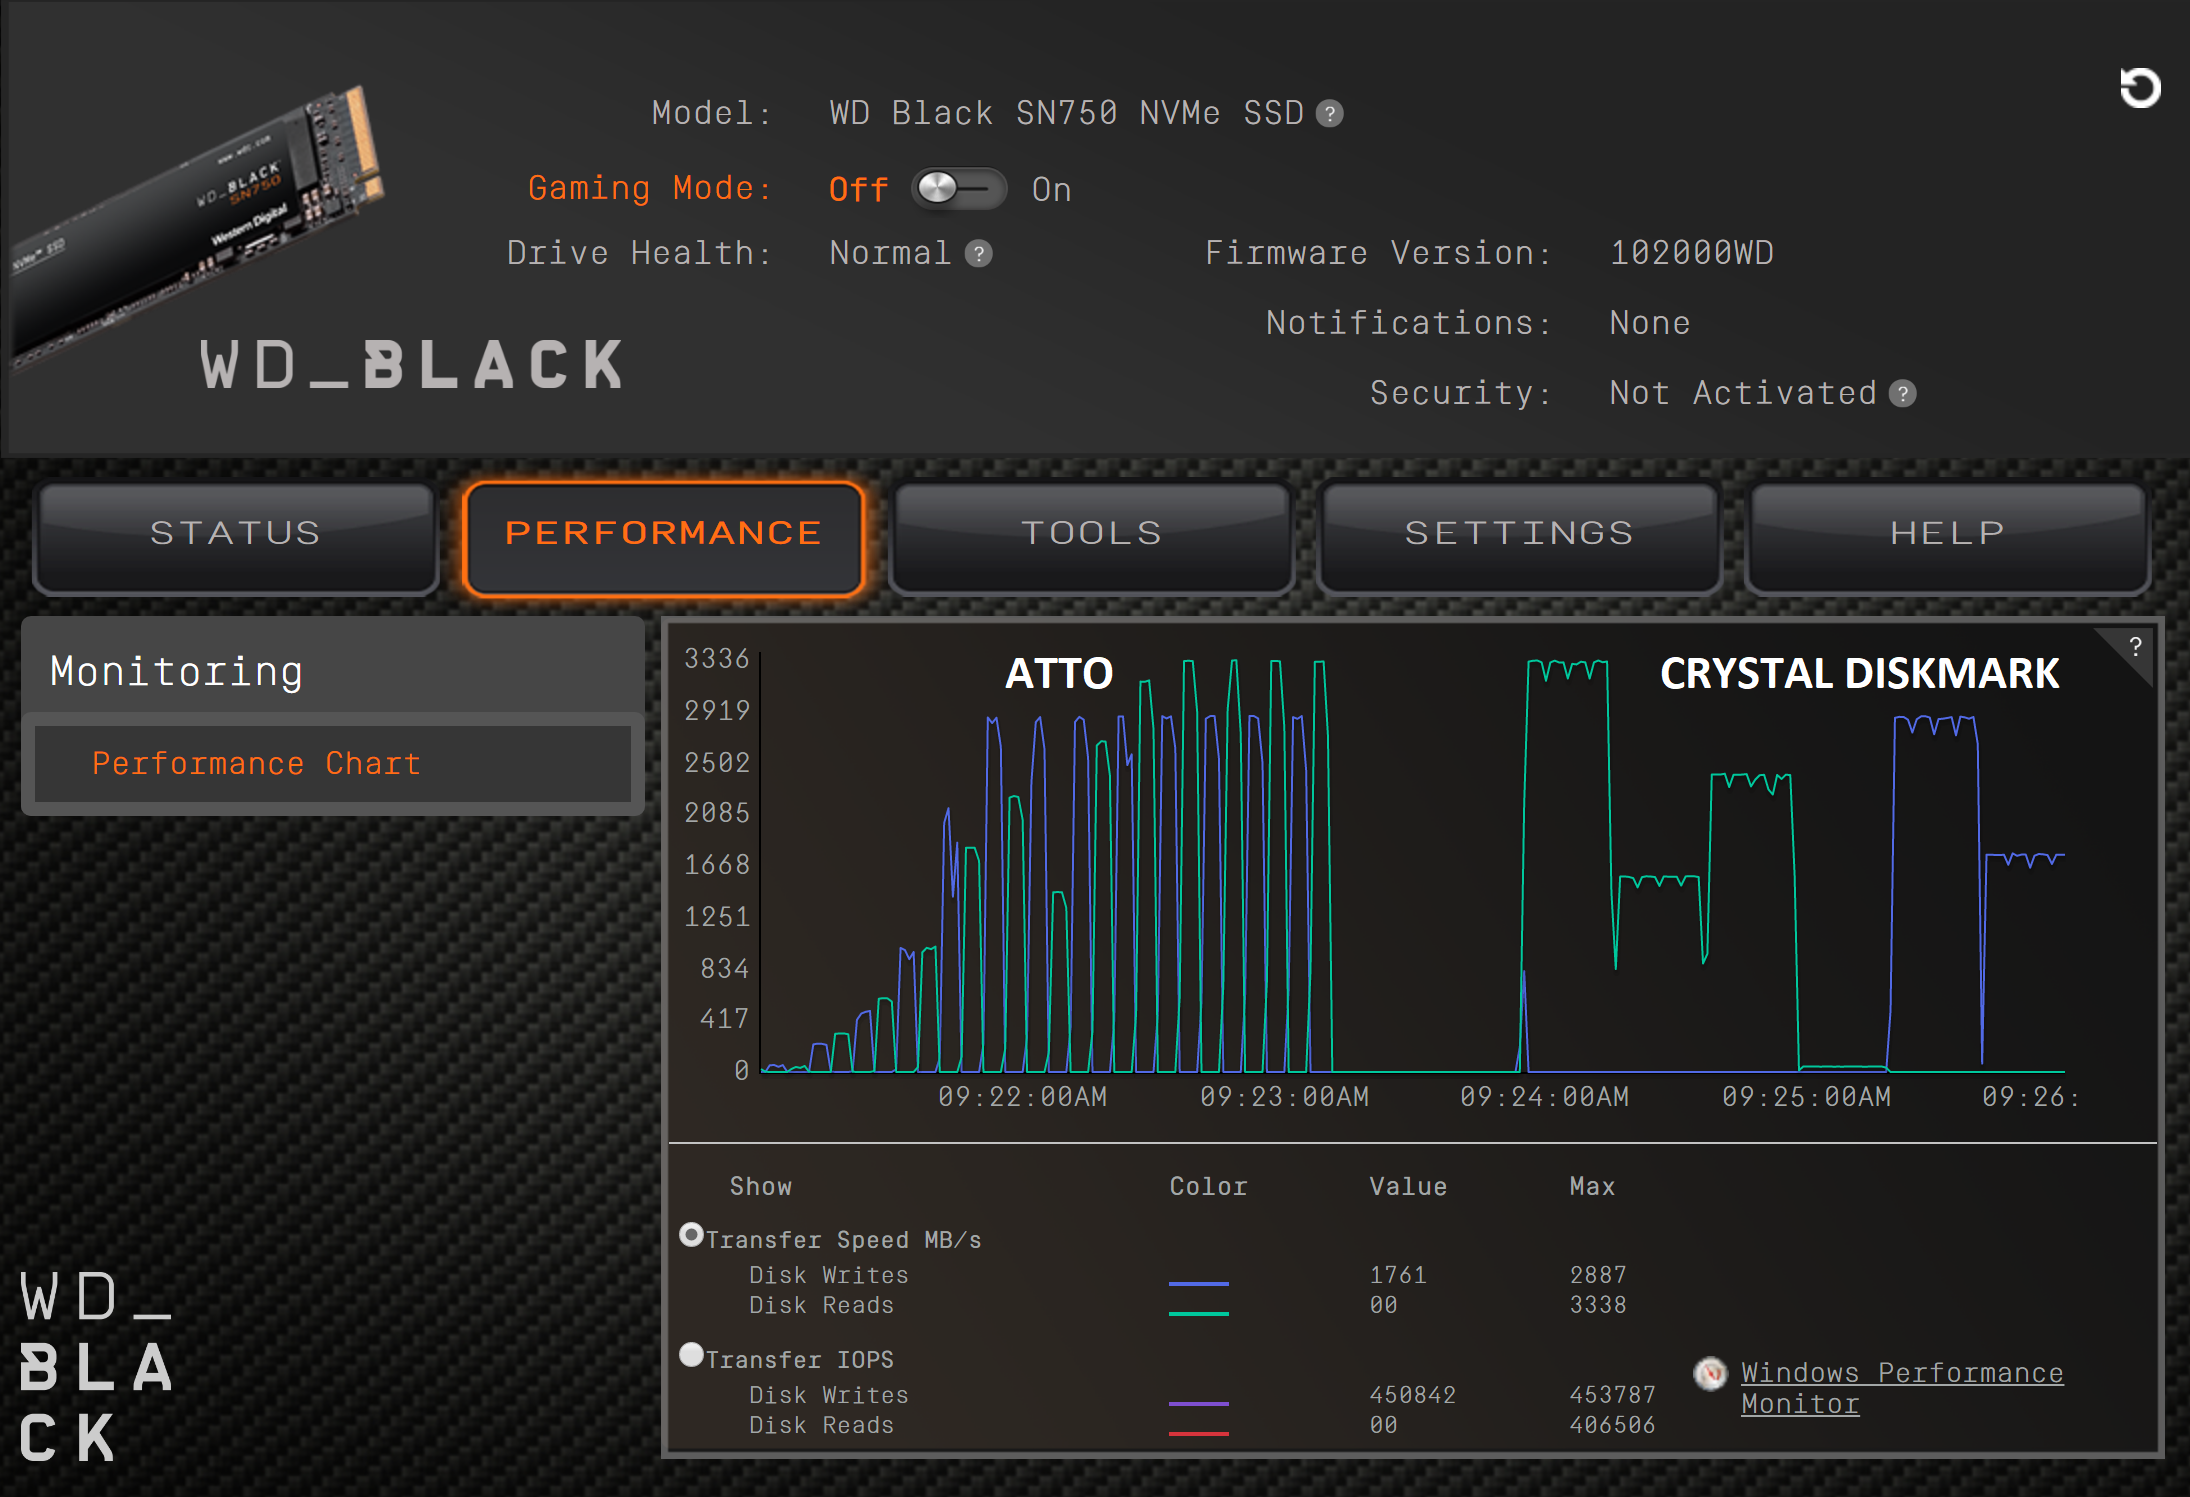
Rather unique is also a screen dedicated to ‘Performance Monitoring’ which uses the Windows Performance Monitor for this. If you look at the results for this specific display, many might recognize the performance increase with gradually increasing samples sizes in ATTO on the left, whereas the results are completely different with Crystal DiskMark on the right.
“WD speaks to SLC cache technology which we discussed in most recent reports. For the most part, this is sold as the reason for SSD performance gain, however, its use is twofold with respect to the newer 3D TLC memory as it is required to reach those performance benchmarks, unlike previous SSDs.”
I think it should be pointed out that SLC caching has existed in every SSD utilizing TLC NAND since its advent, including planar 2D TLC flash. The ADATA SU800, for example, (released in 2016) utilizes a massive dynamic cache buffer due to what was originally an immature controller (SM2258) and the Micron 32-layer 384-Gbit TLC NAND, which is very slow stuff.
In addition, SLC caching algorithms increase endurance, often substantially.
pSLC caching is one part of the reason that 3D TLC surpassed 2D MLC in endurance (substantially) and peak performance, while increasing density; very important for consumers of all types, as MLC is significantly more expensive.
You Said you were going to address the slc cache and potential problems when exceeding it… ??
In every test I see, in real world testing you always stay below that magical slc cache limit, so these drives come out of it looking very good. It’s a bit disappointing because I use a lot of different drives for different purposes and I have not found 1 single TLC drive that shows good sustained sequential speed e.g. Yet review after review, these drives are touted as “just as good” as 970 pro or similar. I guess it comes down to workflow or particular needs of the user. As an example I just bought a jms583 10Gps pcb and a “thumb” drive enclosure for it. Using a thermal pad to dissipate the heat through the aluminium enclosure, even with a Usb 3 host I can sustain ~usb3.0 limit for the whole transfer using an excellent mlc drive. With a tlc drive, the speed drops off so badly after the cache is full, that it prolongs your transfer operation by maybe 200%. Now the same would be true for situations where you generally were working with massive amounts of data.
I mean, every other professional review shows what happens when the SLC cache buffers are exhausted. The thing is, it’s not easy to do. It takes software written just to saturate 30+ queue depths at speeds greater than 3.8GB/s. The majority of consumers could never do this. Certain workstation workloads can, but those people are generally looking at MLC based SSDs.
You state that operations can be prolonged by 200%. 200% of what, exactly?