
MEASURING PERFORMANCE
As with all of our tests, the following tests were performed after a secure erase of the drive. The drive was also conditioned with a predefined workload until it reached steady state. We also test across the entire span of the drive.
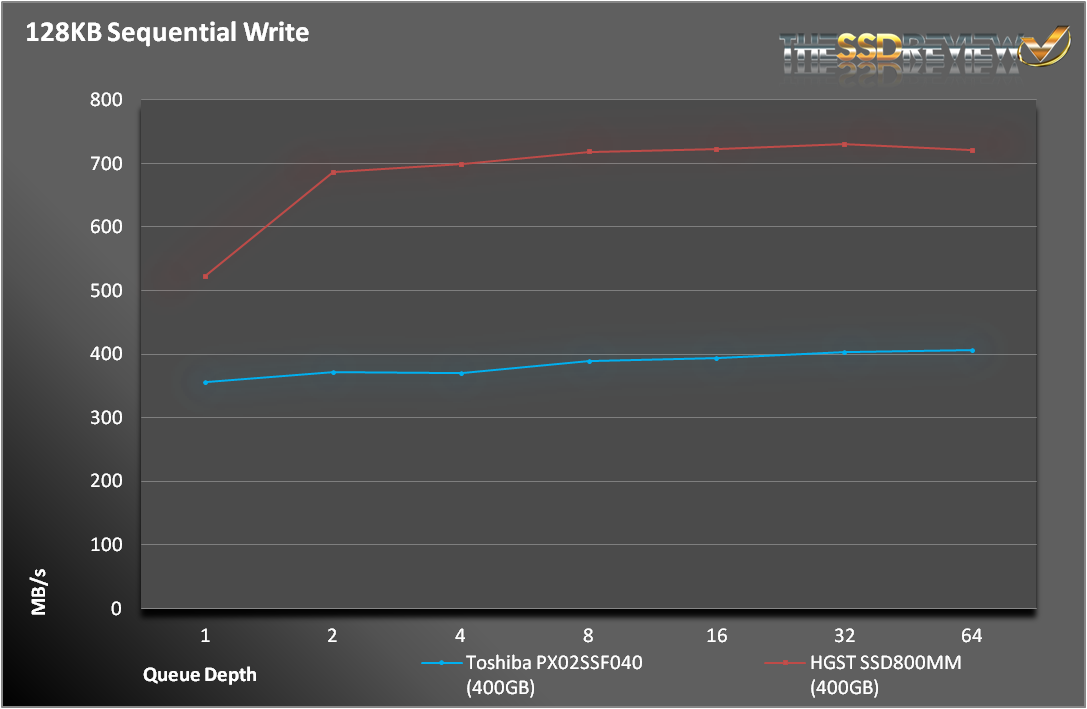
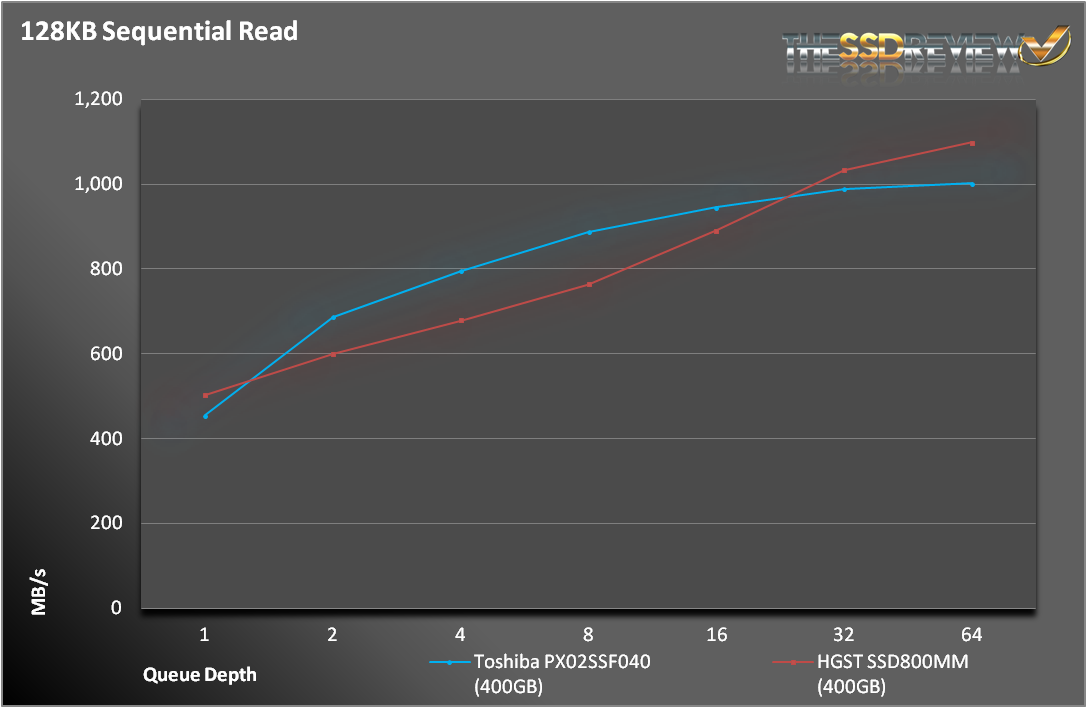
We knew what we were getting into when we started the sequential tests. The write results were very underwhelming, more on par with the Intel S3700 that is 1/3 of the price. Read performance is more what we expected. At nearly double of what you find on 6Gbps SATA/SAS SSDs, read operations take full advantage of the extra interface bandwidth. At certain queue depths, the PX02SS actually took the lead before finally giving way to the HGST.
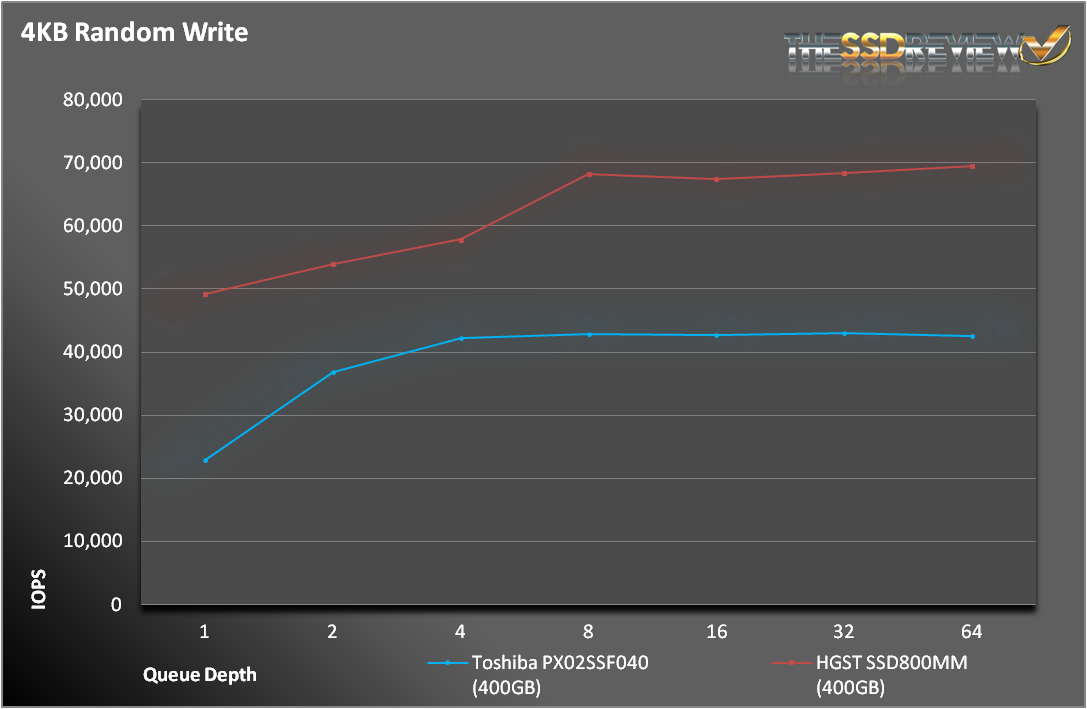
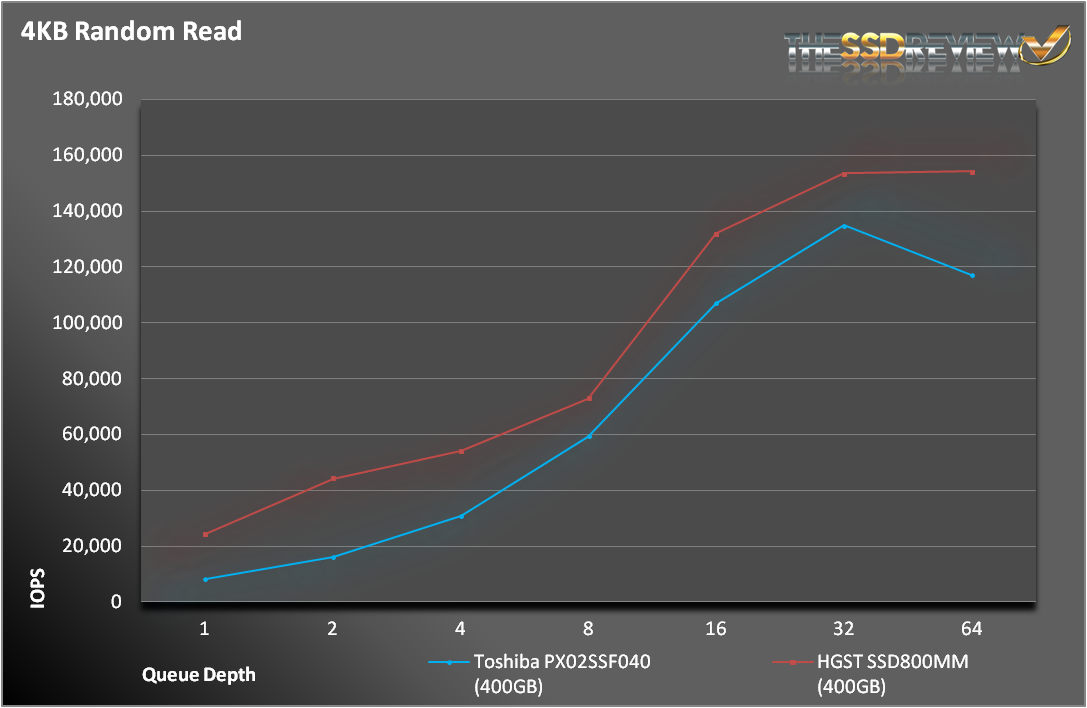
For random 4K writes, the HGST holds a clear and commanding lead over the Toshiba. The difference alone (27K IOPS) would make a formidable SSD. The difference in random 4K reads is much closer, but still a consistent 15-25K IOPS.
Both drives deliver great performance, but the HGST SSD800MM wins in almost every configuration.
SNIA IOPS TESTING
The Storage Networking Industry Association has an entire industry accepted performance test specification for solid state storage devices. Some of the tests are complicated to perform, but they allow us to look at some important performance metrics in a standard, objective way.
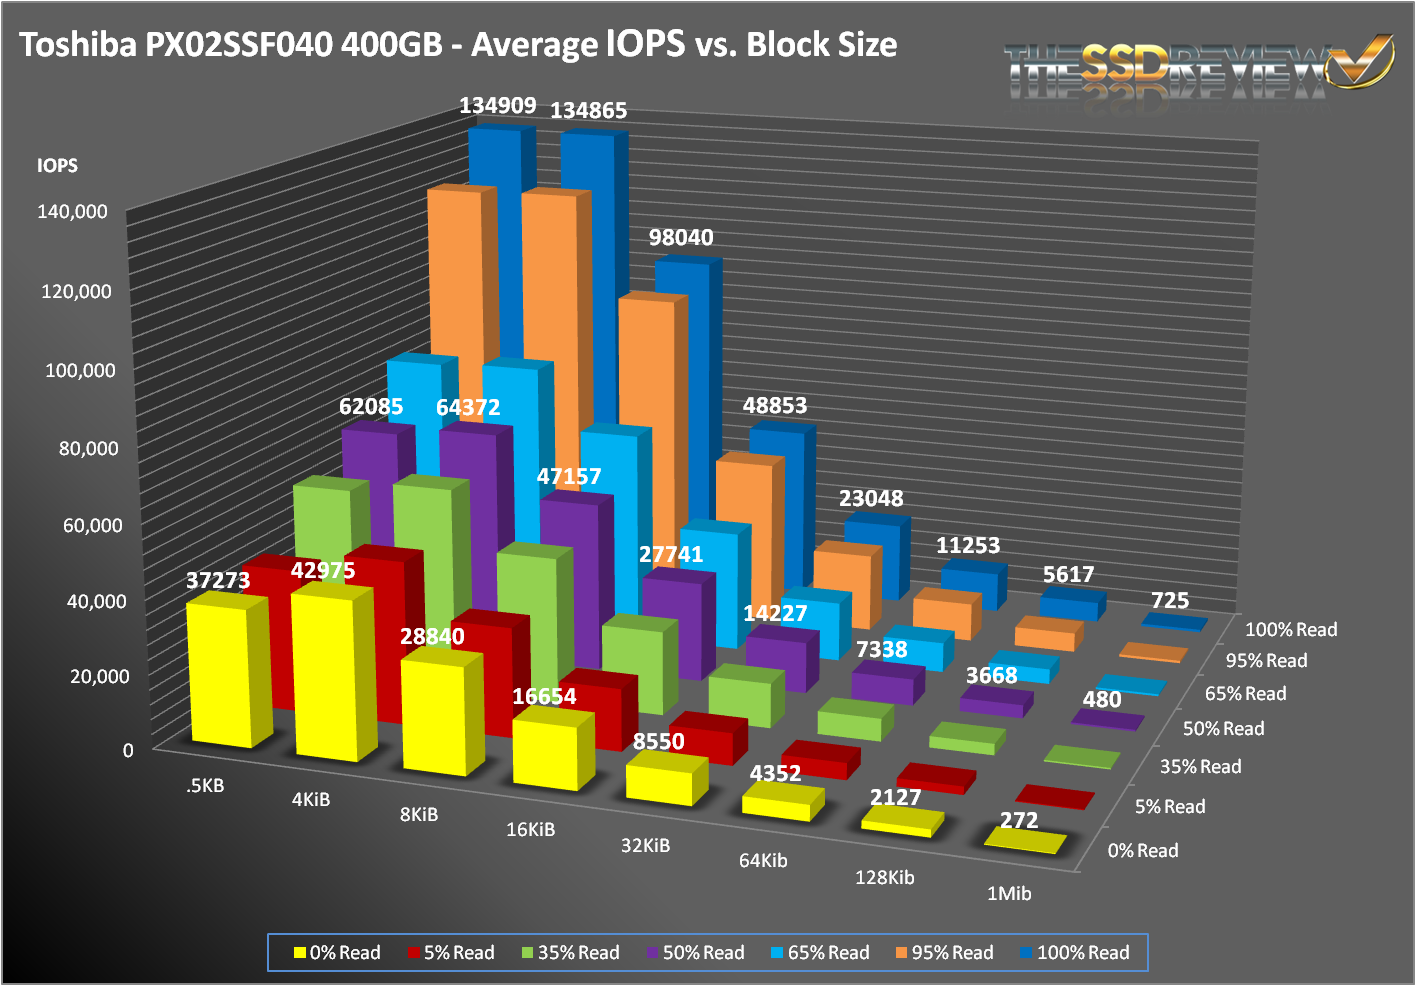
SNIA’s Performance Test Specification (PTS) includes IOPS testing, but it is much more comprehensive than just running 4KB writes with IOMeter. SNIA testing is more like a marathon than a sprint. In total, there are 25 rounds of tests, each lasting 56 minutes. Each round consists of 8 different block sizes (512 bytes through 1MB) and 7 different access patterns (100% reads to 100% writes). After 25 rounds are finished (just a bit longer than 23 hours), we record the average performance of 4 rounds after we enter steady state.
- Preconditioning: 3x capacity fill with 128K sequential writes
- Each round is composed of .5K, 4K, 8K, 16K, 32K, 64K, 128K, and 1MB accesses
- Each access size is run at 100%, 95%, 65%, 50%, 35%, 5%, and 0% Read/Write Mixes, each for one minute.
- The test is composed of 25 rounds (one round takes 56 minutes, 25 rounds = 1,400 minutes)
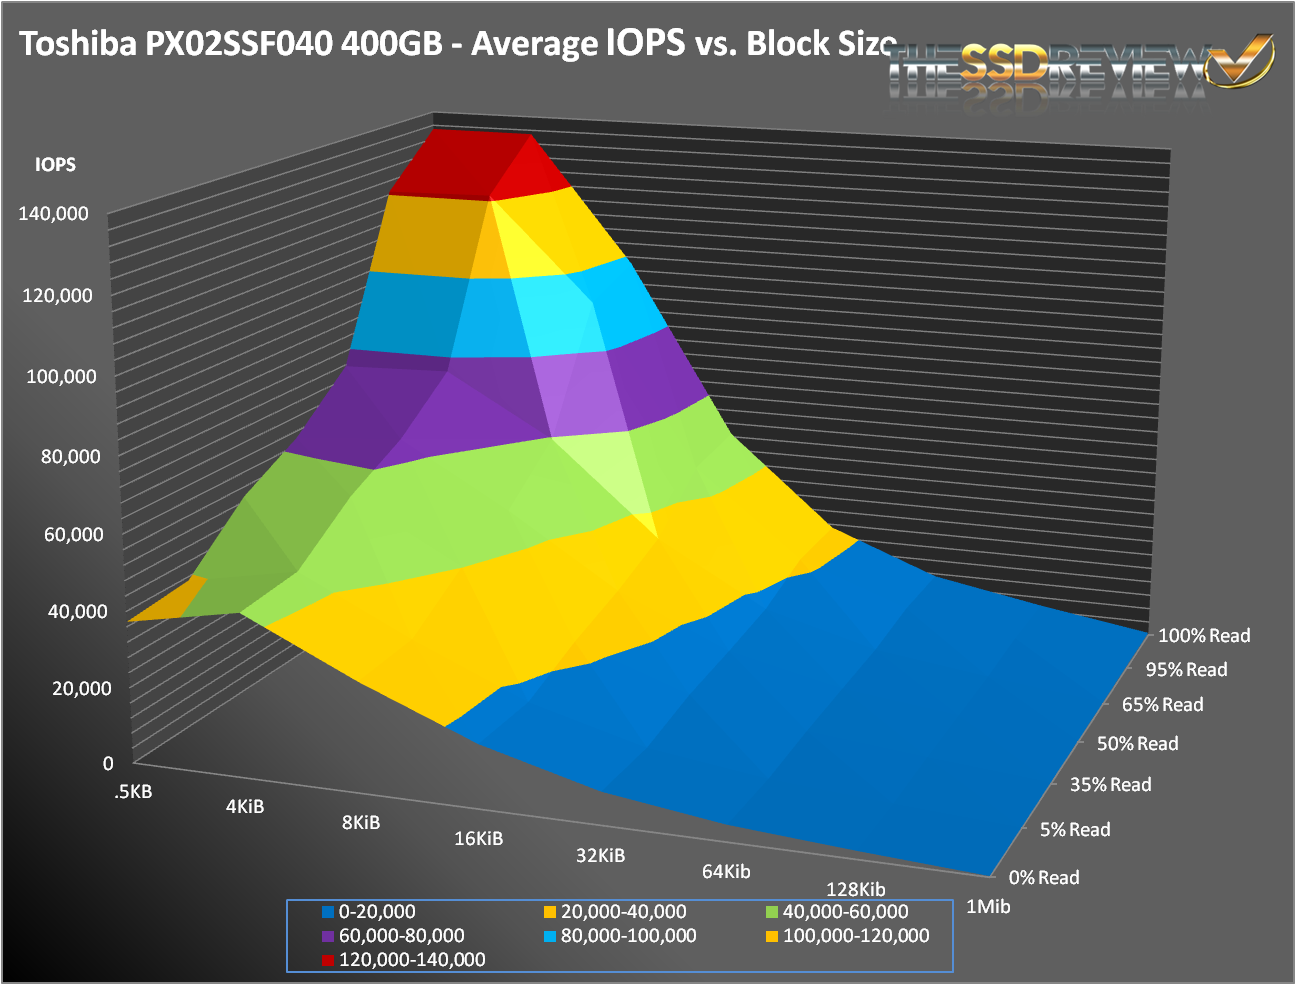
Even though the PX02SS met its specifications at the corners, it just couldn’t match the SSD800MM. But, a funny thing happened when we looked into the SNIA results. In the meaty middle of the chart, the PX02SS actually pulled out a clear win. With workloads between 5 and 95% reads and transfer sizes between 8KB and 1MB, the PX02SS had higher performance in 28 of 30 tests. That is impressive.
These results are indicative of a very good controller that is able to utilize the massive amount of raw NAND at its disposal.
156% op!?!? Man…I’d have been impressed with just 50…lol Glad to see Tosh keeping their game up re: the high end…hope that bleeds over into the consumer market eventually.
Check out your OP calculations!!
1024 GiB of NAND physically installed.
400 GB of user space -> 372.53 GiB
OP = 1 – (372.53 / 1024) = 0.6362
—> 63.62% of the available NAND space is used as OP
It is a 400GB SSD. There is 1024GB (16×64) of memory. Let’s stay away from mixing GiB abd GB and leave it as a very simple calculation which has been accepted by the industry for some time now. Thanks ahead!
This is like saying that [imperial] miles are [nautical] miles, even though in different contexts they mean different things. Whenever the chance of mixing them up arises, you have to clarify what you’re talking about, otherwise you only create confusion and room for error when calculations are involved, like in this case.
We appreciate your comments and believe they display the clarification well. Tx!
Responding just to your point of OP always being calculated on the total amount of NAND, that is not true, it is the amount provisioned over the usable space. So it is (1024-400)/400=1.56 or (1024/400)-1=1.56. I do appreciate you keeping me on my toes 🙂
https://renice-tech.com/documents/Definition_of_Overprovisioning.pdf
Sandforce might be calculating it that way, but it doesn’t make much sense logically speaking although the calculation is mathematically correct. On most (won’t say all because you never know) SSDs the OP is increased/added by taking off user capacity from the installed flash memory (which usually is in “even”, divisible amounts), not by adding flash memory to a preset capacity. Thin difference.