
SNIA IOPS TESTING
The Storage Networking Industry Association has an entire industry accepted performance test specification for solid state storage devices. Some of the tests are complicated to perform, but they allow us to look at some important performance metrics in a standard, objective way. Click to enlarge!
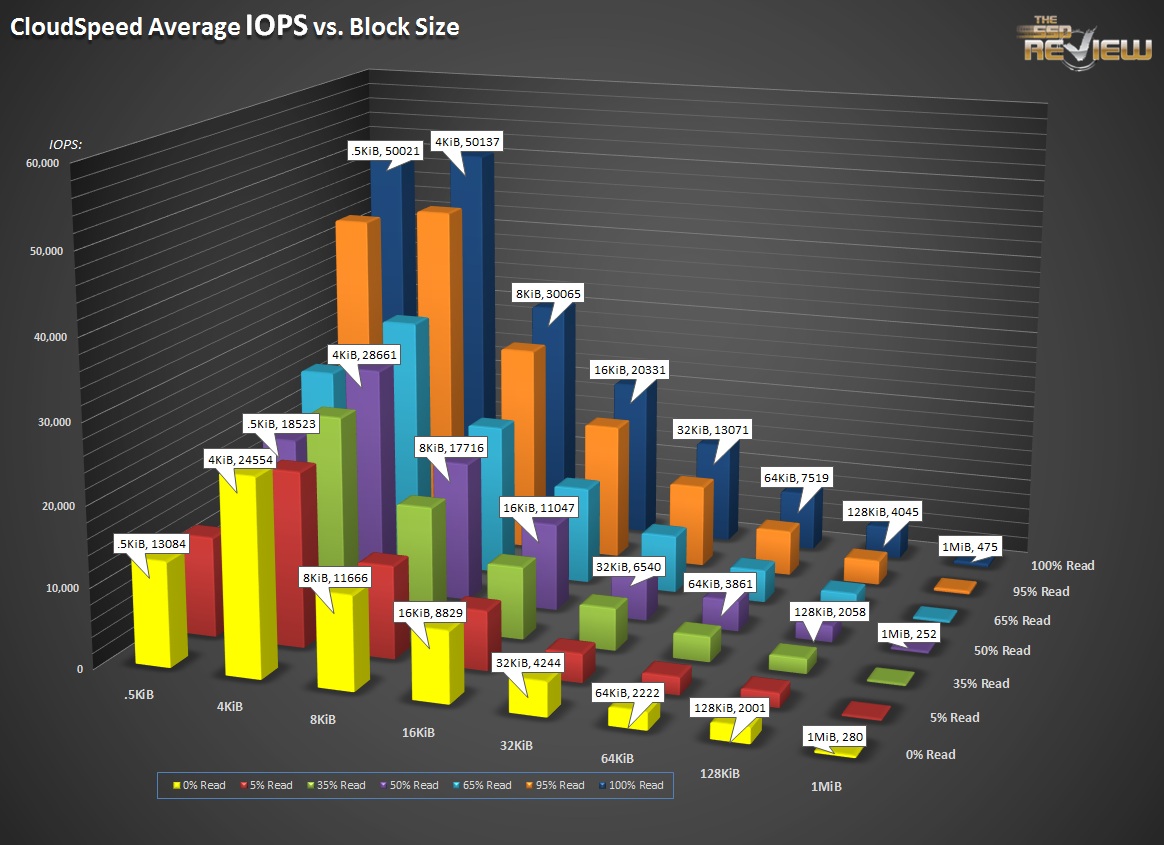
SNIA’s performance test specifications include IOPS testing, but it’s not quite what you’re expecting. It’s composed of 25 rounds of testing, each round taking 56 minutes to complete. We measure IOPS at 8 different block sizes (512 bytes through 1 MB) at 7 different read/write mixes. From 100% read to 0% read (that’s 100% write) and five more mixes in between. Once the 25 rounds are finished (at just under 24 hours), we evaluate the average performance of four of the 25 rounds once steady state is achieved. We can look at the resulting data in different ways, but the column chart you see above is a great indicator of performance.
You can take a closer look at the above graph by clicking on it; 100% read is at the top, 100% write is at the bottom. Block sizes increase from 512 bytes on the left to 1MB on the right. It’s a lot to take in, but the results of this one test can predict the way the drive performs in nearly every other test.
The CloudSpeed 500’s IOPS vs. Blocksize chart looks mostly like you’d expect. It’s an average of results for rounds 18 through 22. Remember though, steady state is only steady state for the workload being examined. Thus, steady state 4K write performance is different than steady state for an email server IOmeter profile or 128K sequential writes, just to give some examples.
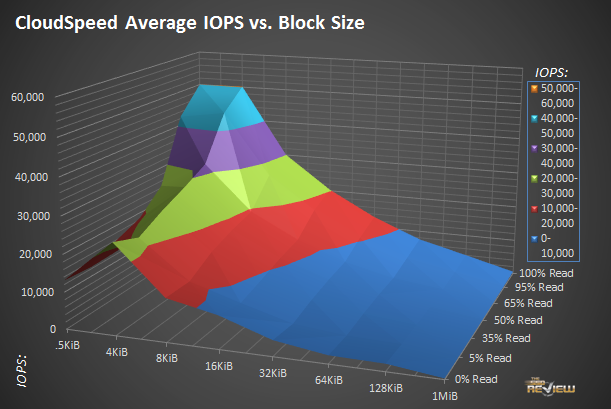
This is the same chart as above, but rendered in a surface chart and not a column. It’s great to get a feel for strengths and weaknesses, and like most drives, reads are prominent. 4K 100% write (0% read) is higher than 5% and 35% reads over the four round average, resulting in a dip. And as is near universal, there is a pronounced slide from 4K to 512b performance.
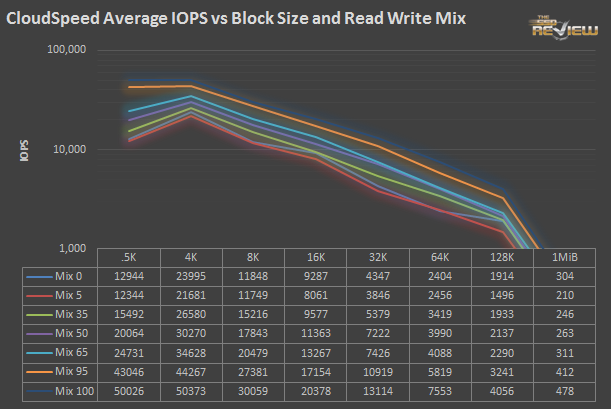
If you were wondering what one round looks like, here is the last one, round 25. Each of the 56 individual tests is listed here.
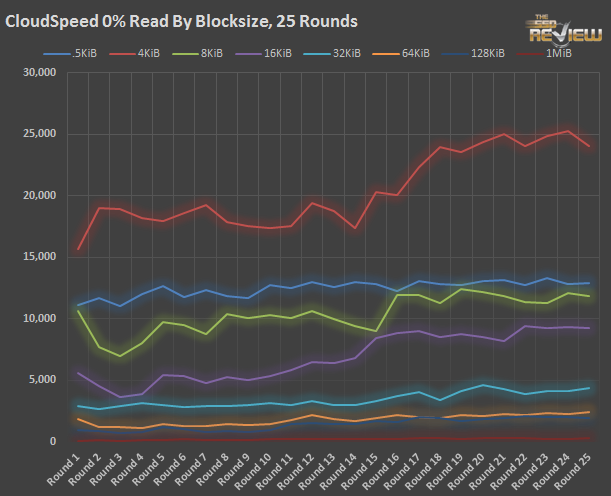
Remember the part about steady state only being applicable for the workload under test? Well, in this case, that’s important to remember. The workload is complex and repeating, yielding interesting results for different drives. This chart is all of the 0% read, 100% write tests for each of the 25 rounds. Contrary to a normal result, the write performance gets better over time, not worse.
Why is that?
A SandForce drive does most of its cleaning up while writing, and the number of larger writes help to clean the drive up during this test. We know what happens if only 4K writes are exposed to the drive because of the write saturation testing from earlier, but when the workload is mixed with lighter read/write and larger block size transfers, the CloudSpeed gets a chance to free up more blocks in flight. Most drives perform garbage collection at idle, but SandForce does the lion’s share of its work on the fly. As a result, the moment the 128K preconditioning is done, the drive starts gradually working its way out of a performance hole during the IOPS testing.