
The SSD Review uses benchmark software called PCMark Vantage x64 HDD Suite to create testing scenarios that might be used in the typical user experience. There are eight tests in all and the tests performed record the speed of data movement in MB/s to which they are then given a numerical score after all of the tests are complete. The simulations are as follows:
- Windows Defender In Use
- Streaming Data from storage in games such as Alan Wake which allows for massive worlds and riveting non-stop action
- Importing digital photos into Windows Photo Gallery
- Starting the Vista Operating System
- Home Video editing with Movie Maker which can be very time consuming
- Media Center which can handle video recording, time shifting and streaming from Windows media center to an extender such as Xbox
- Cataloging a music library
- Starting applications
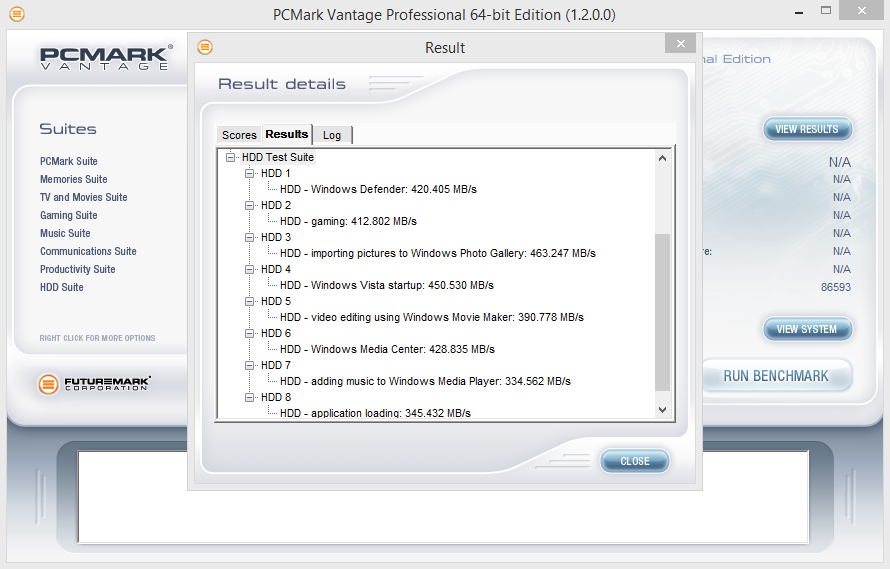
PCMARK VANTAGE RESULTS
This SM2256 controller did very well in our PCMark Vantage Benchmark, much better than the SM2246EN when we first tested it last year. It achieved a Total Score of 86,593 points and the highest transfer speed of 463MB/s was recorded during the “Importing Pictures to Windows Photo Gallery” benchmark. The lowest speed of 335MB/s was recorded during the “Adding Music to Windows Media Player” benchmark. Overall, this SSD controller is proving to be quite a competitor for the mainstream market. Let’s continue on to our PCMark 8 test and see how it fares.
For our last benchmark, we have decided to use PCMark 8 Extended Storage Workload in order to determine steady state throughput of the SSD. This software is the longest in our battery of tests and takes just under 18 hours per SSD. As this is a specialized component of PCMark 8 Professional, its final result is void of any colorful graphs or charts typical of the normal online results and deciphering the resulting excel file into an easily understood result takes several more hours.
There are 18 phases of testing throughout the entire run, 8 runs of the Degradation Phase, 5 runs of the Steady State Phase and 5 runs of the Recovery Phase. In each phase, several performance tests are run of 10 different software programs; Adobe After Effects, Illustrator, InDesign, Photoshop Heavy and Photoshop Light, Microsoft Excel, PowerPoint and Word, as well as Battlefield 3 and World of Warcraft to cover the gaming element.
- PRECONDITIONING -The entire SSD is filled twice sequentially with random data of a 128KB file size. The second run accounts for overprovisioning that would have escaped the first;
- DEGRADATION PHASE – The SSD is hit with random writes of between 4KB and 1MB for 10 minutes and then a single pass performance test is done of each application. The cycle is repeated 8 times, and with each time, the duration of random writes increases by 5 minutes;
- STEADY STATE PHASE – The drive is hit with random writes of between 4KB and 1MB for 45 minutes before each application is put through a performance test. This process is repeated 5 times;
- RECOVERY PHASE – The SSD is allowed to idle for 5 minutes before and between performance tests of all applications. This is repeated 5 times which accounts for garbage collection; and
- CLEANUP – The entire SSD is written with zero data at a write size of 128KB
In reading the results, the Degrade and Steady State phases represent heavy workload testing while the recovery phase represents typical consumer light workload testing.
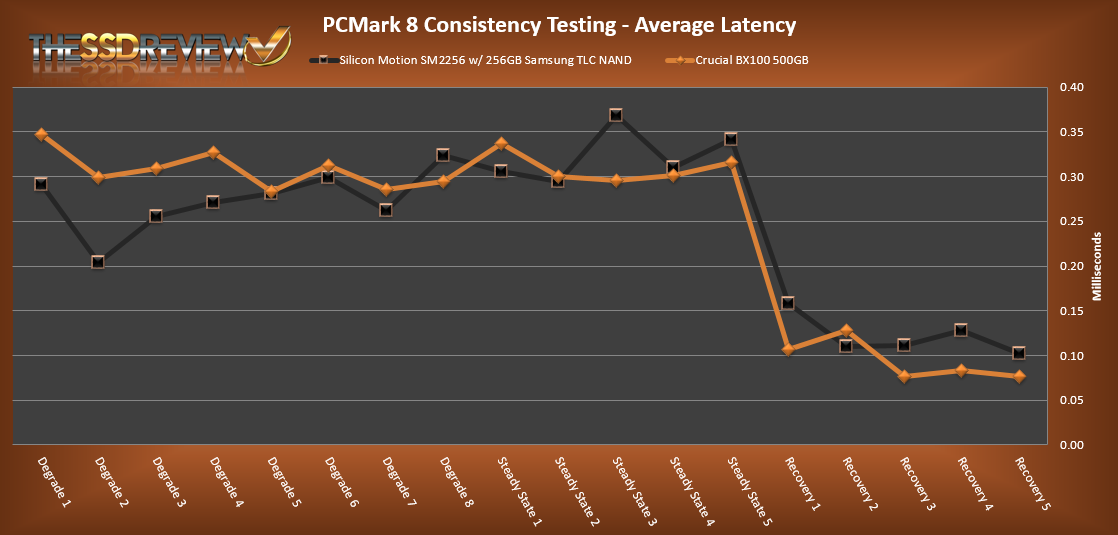
As you can see, performance is recorded in terms of Bandwidth and Latency. Bandwidth (or throughput) represents the total throughput the drive is able to sustain during the tests during each phase. Latency, at least for the purposes of PCMark 8, takes on a different outlook and for this, we will term it ‘Total Storage latency’. Typically, latency has been addressed as the time it takes for a command to be executed, or rather, the time from when the last command completed to the time that the next command started. This is shown below as ‘Average Latency’.
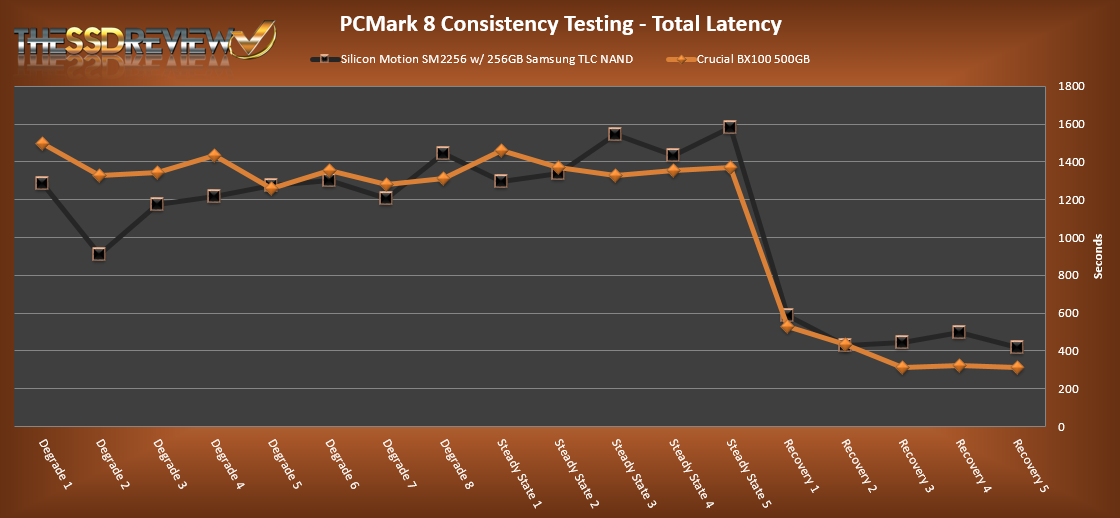
PCMark 8 provides a slightly different measurement, however, that we are terming as ‘Total Storage Latency’. This is represented as being the period from the time the last command was completed, until the time it took to complete the next task; the difference of course being that the execution of that task is included in ‘Total Storage Latency’. For both latency graphs, the same still exists where the lower the latency, the faster the responsiveness of the system will be. While both latency charts look very similar, the scale puts into perspective how just a few milliseconds can increase the length of time to complete multiple workloads.
For a more in-depth look into Latency, Bandwidth, and IOPS check out our primer article on them here.
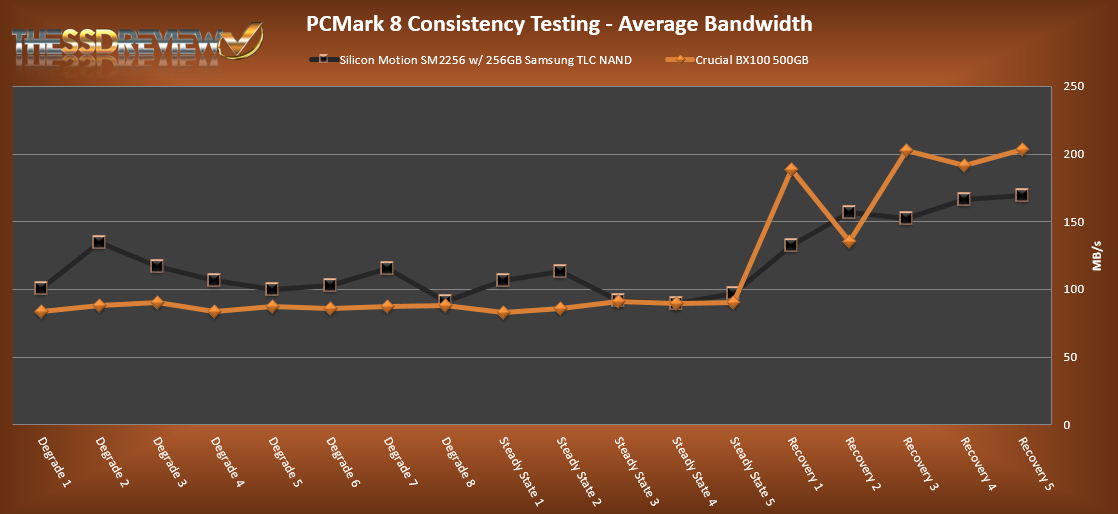
AVERAGE BANDWIDTH (OR THROUGHPUT)
These results show the total average bandwidth across all tests in the 18 phases. In this graph the higher the result the better.
AVERAGE LATENCY (OR ACCESS TIME)
These results show the average access time during the workloads across all tests in the 18 phases. In this graph the lower the result the better.
TOTAL STORAGE LATENCY
These results show the total access time across all tests in the 18 phases. In this graph the lower the result the better.
As you had seen earlier, this review sample did not come with both sides to its shell, thus there was no thermal pad to allow the controller better heat dissipation. Even without proper cooling results with TLC NAND seem very close to what we have seen with the older SM2246EN controller with MLC NAND. Overall, we see that there is some good consumer performance with this new Silicon Motion controller. Once we start seeing some more SSDs with this controller and proper cooling we can take a better look to see how it performs, most likely even better.
> You can see that the write performance drops off soon after the 12GB mark and fluctuates between 25MB/s and 125MB/s.
Wow, thats really bad for a 256GB drive. I mean, even the first generation 840 had write speeds around 250MB/s.
Either Samsung is pulling some wizardry with their controller/firmware (on sustained write, no slc) or this is just a very poorly binned TLC.
Have you notice the samsung sticker is warped and cooking off? I’m not aware of any Samsung chips that uses sticker as its label, actually, I don’t know ONE proper semiconductor company that does that.
The wording underneath the sticker says FORSEE, and that’s the trademark from another company:
https://www.foresee.cc/
So, what the heck are we testing anyways?
I’m gussing foresee is packaging the nand (but bare dies are still from samsung) and building/assambling the board.
If that’s the case, samsung will NOT allow them to mark it as Samsung, because it is NOT packaged and tested by them. Most likely they are unknown flash chip that were rejected as second or third grade stuff, sold as unmarked chip or bare die.
Most of the time those goes into no-name SSD or USB flash drive. Do you see a lot of the cheaper SSD have chips that is almost completely blank? Bingo!
I know because RAM is exactly like that, and I used to help a friend with his RAM wholesale business.
Good job, reading between the lines! Did anyone else notice the FORSEE?
With the rise of TLC nand will come more unreliable SSDs that will expire faster. MLCs and even SLCs could have been made more affordable but the major manufacturers fking blew it. Goodbye SSD. Welcome back HDD.