
MEASURING PERFORMANCE
As with all of our tests, the following tests were performed after a secure erase of the drive. The drive was also conditioned with a predefined workload until it reached steady state. We also test across the entire span of the drive.
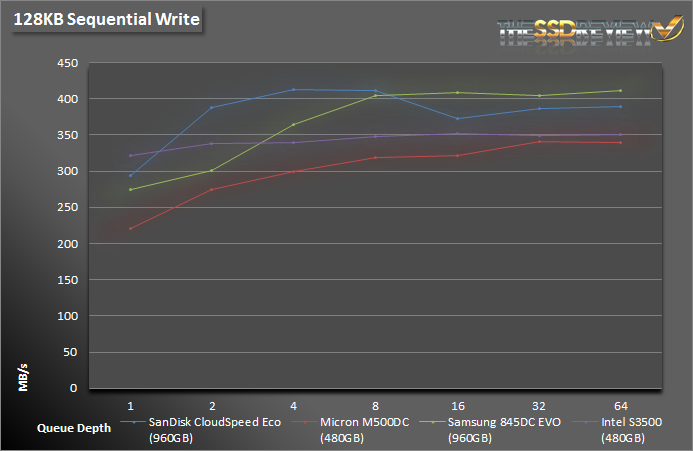
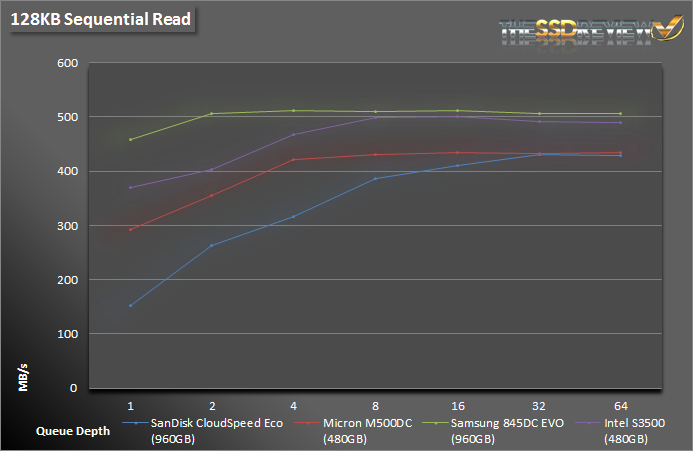
During our sequential write test we can see that the CloudSpeed Eco delivers great performance up to QD 8 reaching about 420MB/s, but then drops down slightly after that to about 375MB/s. In testing sequential reads it didn’t perform too well until a QD of 16 was reached where we saw performance over 400MB/s and overall read performance was lower than all other SSDs in comparison.
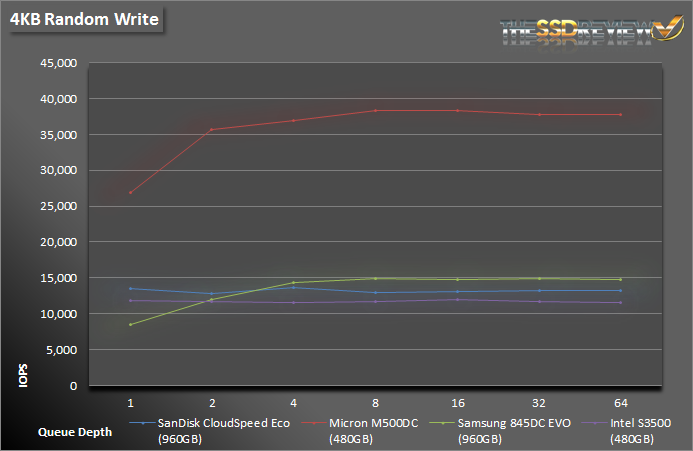
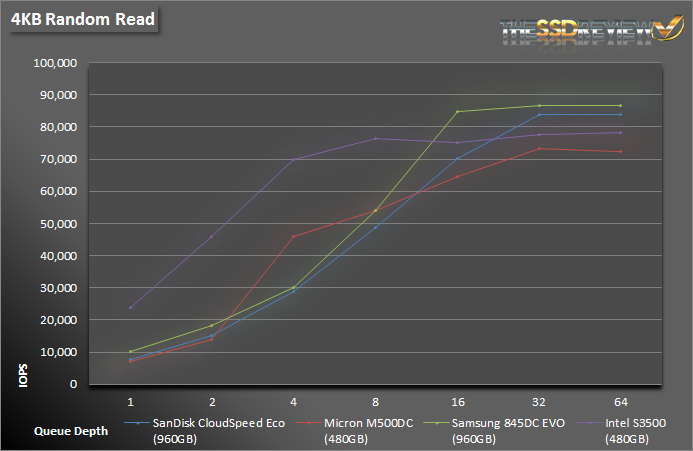 During our random read and write testing we seen a bit better performance. Write IOPS were fairly consistent across all queue depths maintaining around 13-14K. Random read IOPS peaked out at over the rated 80K at QD 32, however, overall we see that it is shadowed by the Samsung 845DC EVO.
SNIA IOPS TESTING
The Storage Networking Industry Association has an entire industry accepted performance test specification for solid state storage devices. Some of the tests are complicated to perform, but they allow us to look at some important performance metrics in a standard, objective way.
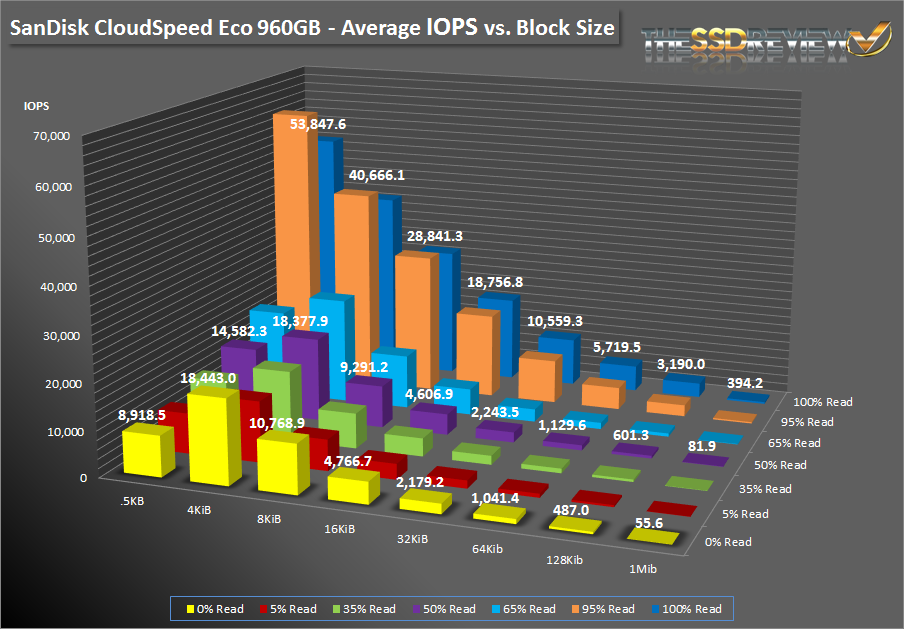
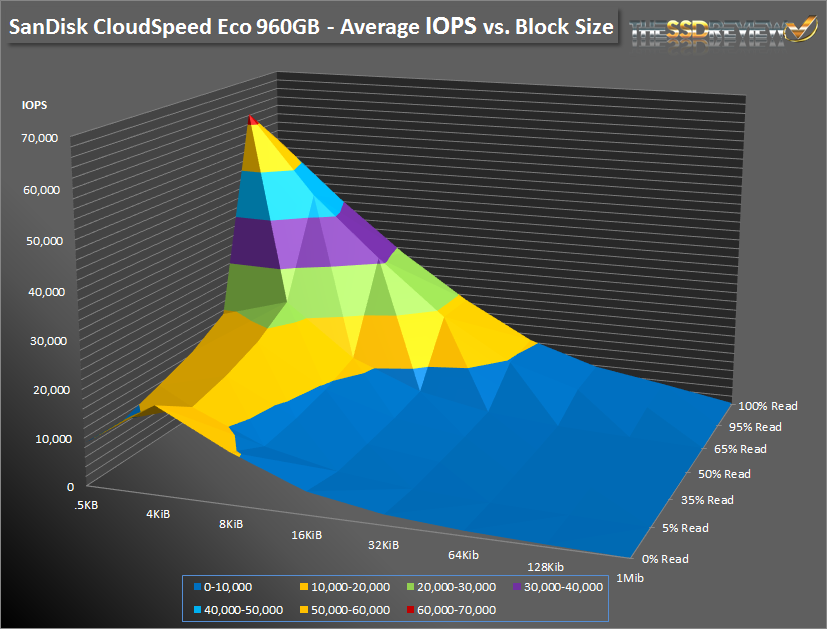
SNIA’s Performance Test Specification (PTS) includes IOPS testing, but it is much more comprehensive than just running 4KB writes with Iometer. SNIA testing is more like a marathon than a sprint. In total, there are 25 rounds of tests, each lasting 56 minutes. Each round consists of 8 different block sizes (512 bytes through 1MB) and 7 different access patterns (100% reads to 100% writes). After 25 rounds are finished (just a bit longer than 23 hours), we record the average performance of 4 rounds after we enter steady state.
- Preconditioning: 3x capacity fill with 128K sequential writes
- Each round is composed of .5K, 4K, 8K, 16K, 32K, 64K, 128K, and 1MB accesses
- Each access size is run at 100%, 95%, 65%, 50%, 35%, 5%, and 0% Read/Write Mixes, each for one minute.
- The test is composed of 25 rounds (one round takes 56 minutes, 25 rounds = 1,400 minutes)
Unlike our other performance tests, the SNIA tests only last for a relatively short period of time each (1 minute), but they cover many more access patterns and transfer sizes. You may have noticed that some of the SNIA results are higher or lower than in our other tests. The reason for this is because SSD performance is heavily predicated on previous workloads. Toggling between large and small blocks and reads to writes is stressful on the drive and results can vary. This is why we take the average of multiple runs. What it does show is how well a drive’s firmware can perform garbage collection, TRIM and many other internal housekeeping tasks.
In our SNIA testing, the SanDisk CloudSpeed Eco performed decently, but could have done a bit better. While random 4K writes reached their rated spec across read/write workloads, 4K reads did not, maxing out at 62K IOPS. From 0% read to 65% read performance was relatively similar per file size, save for the 5% read/95% write mix. It wasn’t until 95% read that we saw a large jump in performance. From 0.5KB-8KB file sizes performance in this mix is higher than when at 100% read.