
ATTO Disk Benchmark is perhaps one of the oldest benchmarks going and is definitely the main staple for manufacturer performance specifications. ATTO uses RAW or compressible data and, for our benchmarks, we use a set length of 256mb and test both the read and write performance of various transfer sizes ranging from 0.5 to 8192kb. Manufacturers prefer this method of testing as it deals with raw (compressible) data rather than random (includes incompressible data) which, although more realistic, results in lower performance results.
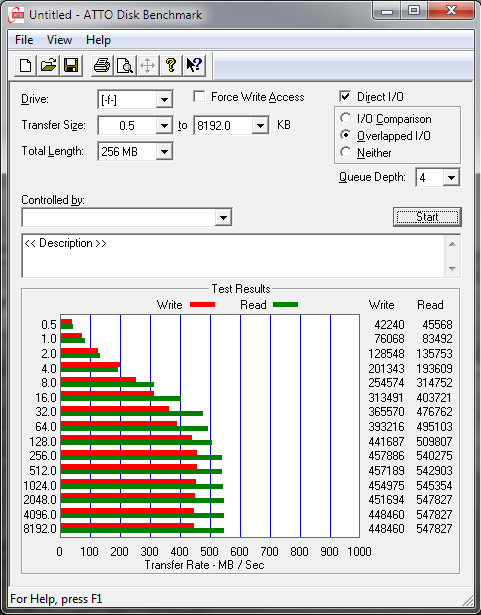
ATTO read and write performance highs of 547MB/s and 457MB/s are almost dead on the listed specifications of 540MB/s read and 460MB/s write which is a great start.
CRYSTAL DISK BENCHMARK VER. 3.0 X64
Crystal Disk Benchmark is used to measure read and write performance through sampling of highly compressible data (oFill/1Fill), or random data which is, for the most part, incompressible. In the M5 Pro, we have provided the result with random data samples as both results were extremely similar.
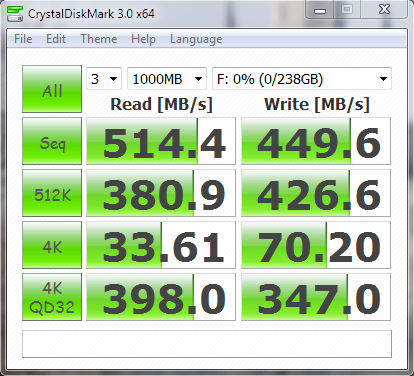
Crystal DiskMark is typical, although we would have like to see low 4k random write scores coming in a bit higher. Keeping in mind that this is not a new release, we are always hoping to see SSDs come in above the 100MB/s low 4k random write point which is still relatively uncommon.
Up until recently, AS SSD was the only benchmark created specifically for SSD testing and it uses incompressible data. AS SSD, for the most part, gives us the worst case scenario in SSD transfer speeds because of its use of incompressible data and many enthusiasts like to AS SSD for their needs. Transfer speeds are displayed on the left with IOPS results on the right.
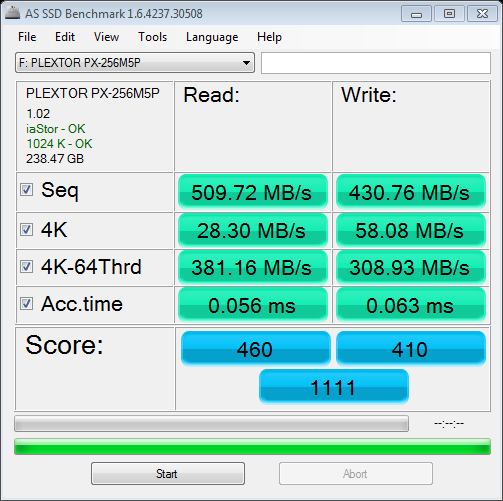
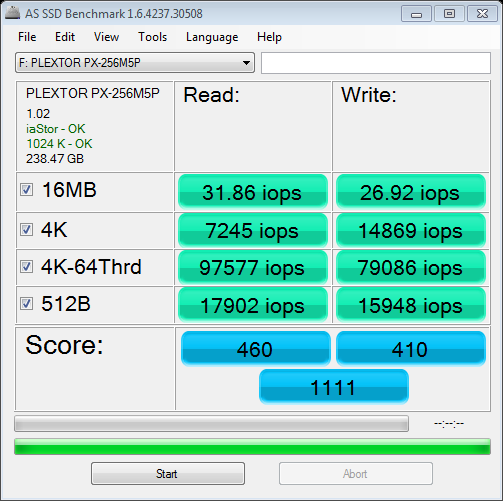 Two things are very predominent in AS SSD testing that would result in such a high Total Score, these being the incredibly fast Access Times and the 4k-64Thrd IOPS of just under 100,000 IOPS read and 80,000 IOPS write.
Those writes are a bit “meh” for such modern controller when a 2 year old, very simple SandForce SF-2281 blows them away.
If you want the absolute best, 840 Pro. If bang for the buck, SandForce. 🙂
you’re outta your mind when you try to compare Marvell to Sandforce.
And why exactly is that? I do realize this new Marvell controller is superior to SF, however, it still doesn’t change the fact that those sequintal writes are “meh” at this time and date and that the SF-2281 blows them away. Period on that.
your SF goes “meh” when it comes to incompressible data
You can close compression on SandForce to boost it’s incompressible performance, which renders it slower under other conditions, but still.
My point was that, this drive DOES have “meh” sequintal writes and that’s a fact. When the MDX Tri-Core Samsung’s blow this thing away, I see no point in buying into this drive.
As I said before, if you want the BEST SSD, get the 840 Pro. If not, then there’s nothing wrong with SandForce as they’re still great and very fast SSD’s. And are MUCH better bang for the buck than this drive.
You are currently showing this as slower than the (unnamed specific capacity, but it is) 512GB Samsung 840 Pro. While comparing different capacities is not really fair, I wonder if the benchmarks really say anything beyond the specific system. Take these numbers e.g. ( https://i1-news.softpedia-static.com/images/news2/Plextor-s-Top-Performing-M5P-Series-Benchmarked-7.png ) for the M5P, showing higher speeds than the 840P/512 for the plextor in the 4K section, while being lower in the 64Thrd scenario, which in your tests really seems to be its strong point.
So what I mean to say: Even when there are differences of more than 10%, do they really say anything about this specific SSD or rather more about the SSD in this system? Especially the fact that the other benchmarks shows faster speeds for the 4k single threaded makes me think that there are way more factors not being reflected in these benchmarks and that the only thing really able to tell this apart would be involve many differently configured systems, possibly even chipsets.
You are absolutely correct. Different equipment, chipsets, drivers, and even optimizations will result in a different performance standard. The important thing for any test environment to tackle is to ensure that all testing is exactly the same where a comparison from one solid-state drive to another can be drawn. For example, you will find higher 4k write performance scores from other websites because they optimize their CPU settings. We believe this specific optimization is too difficult for the common user and want to ensure that our scores reflect what they are able to achieve in their own testing. Simply put, our testing is the same result that can be achieved by any user after first installing their SSD. Hope this helps.
SKYPE=ROCKY-TIGER-USA G-TALK=PRINCESS.JASMINE.WOOD@GMAIL.COM MSN LIVE=TIGER_0717@HOTMAIL.COM MSN LIVE=ROCKY_0717@YAHOO.COM MSN LIVE=ROCKY-TIGER@WINDOWSLIVE.COM QQ=859061471 AOL-AIM=ROCKY_TIGER@AOL.COM
SKYPE=ROCKY-TIGER-USA G-TALK=PRINCESS.JASMINE.WOOD@GMAIL.COM MSN LIVE=TIGER_0717@HOTMAIL.COM MSN LIVE=ROCKY_0717@YAHOO.COM MSN LIVE=ROCKY-TIGER@WINDOWSLIVE.COM QQ=859061471 AOL-AIM=ROCKY_TIGER@AOL.COM
SKYPE=ROCKY-TIGER-USA G-TALK=PRINCESS.JASMINE.WOOD@GMAIL.COM MSN LIVE=TIGER_0717@HOTMAIL.COM MSN LIVE=ROCKY_0717@YAHOO.COM MSN LIVE=ROCKY-TIGER@WINDOWSLIVE.COM QQ=859061471 AOL-AIM=ROCKY_TIGER@AOL.COM