
A discussion of benchmarks would not be fair without a brief reminder that we quite often look in the wrong place for performance in our SSDs. If you look at the Crystal scores below, the 4K random measurements are actually the criteria by which the reader will see the most visible difference from their previous storage medium. Briefly, small 4kb random reads and writes account for over 50% of disk access in normal use. They account for the speed in which the OS and applications start and are maintained through execution of so many of dynamic link libraries (DLLs).
Most typical users will never use the top high volume sequential reads and writes (as seen below beside ‘SEQ’) that we like to give so much praise in SSD purchases and which are utilized to identify top performing SSDs, sometimes incorrectly so. These access methods actually account for less than 1% of typical use and are reserved for more intensive tasks such as video compilation and editing.
For all below benchmarks, the OWC Mercury Extreme Pro RE is on the left and the Intel X25-m is on the right.
1. Crystal Disk Mark Ver. 3.0 x64

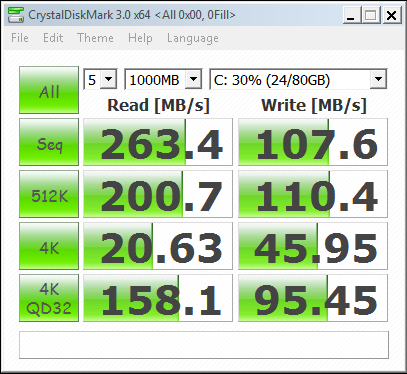
In examining the first set of benchmarks above, the OWC (left) surpasses the Intel in all access levels including the random 4kb scoring, something that hasn’t been accomplished until only recently with the SandForce and Marvell controller releases. Technological advance has many SSD enthusiasts waiting for the Intel Gen 3 SSD release as it is generally believed that Intel had capped its write scores for the initial X25 releases. With respect to the OWC Crystal score, please observe that the drive was tested while being only 15% filled as this will become an important consideration further into this review.
2. ATTO Disk Benchmark Ver. 2.46


3. HDTune Pro Ver. 4.01 – Benchmark


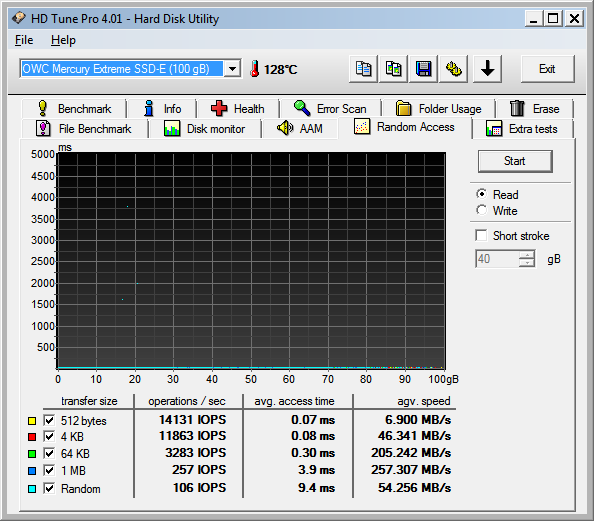
For those new to solid state drives, a big difference from hard drives is the much quicker access time of the SSD which is typically .1ms compared to 6.9ms of the WD Velociraptor HDD. This assists in a visible performance improvement in all activities of the SSD along with a decrease in CPU usage.
4. HDTune Pro Ver. 4.01 – File Benchmark
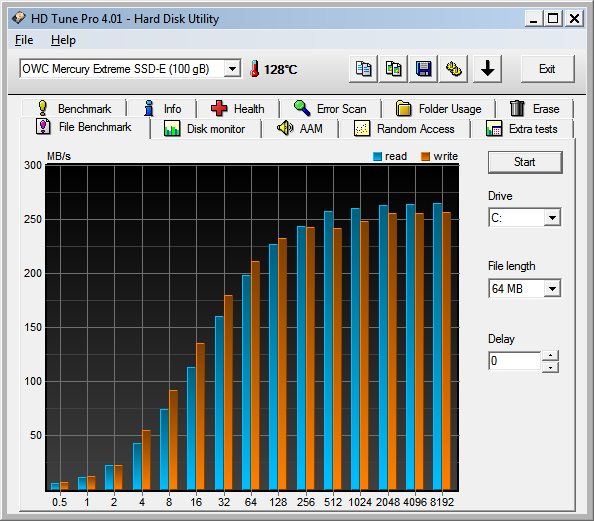
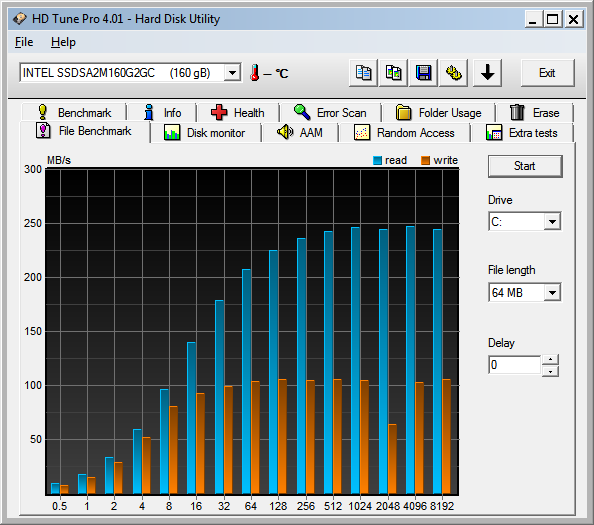
The HDTune File Benchmark is an excellent medium to portray how the Intel appears to be capped at about 100MB/s in its write speeds. This is still simply a belief as Intel hasn’t commented either way with respect to it.
5. HDTune Pro Ver. 4.01 – Random Access

6. PCMark Vantage x64 HDD Suite
This software is utilized to compare the OWC and the Intel SSDs in benchmarks which imitate normal user activities. A set of eight different tests are described below, the result of each being a measure of drive speed to complete the activity. The overall Vantage HDD Suite Score of the OWC was a 27983 whereas the Intel was 23124 as a result of the following tests:

The OWC excelled at this battery of tests with the Intel only pulling ahead on Movie Maker Video Editing and Adding Music To Media Player..