
PCMARK 8 EXTENDED STORAGE WORKLOAD CONSISTENCY TESTING
For our last benchmark, we have decided to use PCMark 8 Extended Storage Workload in order to determine steady state throughput of the SSD. This software is the longest in our battery of tests and takes just under 18 hours per SSD. As this is a specialized component of PCMark 8 Professional, its final result is void of any colorful graphs or charts typical of the normal online results and deciphering the resulting excel file into an easily understood result takes several more hours.
There are 18 phases of testing throughout the entire run, 8 runs of the Degradation Phase, 5 runs of the Steady State Phase and 5 runs of the Recovery Phase. In each phase, several performance tests are run of 10 different software programs; Adobe After Effects, Illustrator, InDesign, Photoshop Heavy and Photoshop Light, Microsoft Excel, PowerPoint and Word, as well as Battlefield 3 and World of Warcraft to cover the gaming element.
- PRECONDITIONING -The entire SSD is filled twice sequentially with random data of a 128KB file size. The second run accounts for overprovisioning that would have escaped the first;
- DEGRADATION PHASE – The SSD is hit with random writes of between 4KB and 1MB for 10 minutes and then a single pass performance test is done of each application. The cycle is repeated 8 times, and with each time, the duration of random writes increases by 5 minutes;
- STEADY STATE PHASE – The drive is hit with random writes of between 4KB and 1MB for 45 minutes before each application is put through a performance test. This process is repeated 5 times;
- RECOVERY PHASE – The SSD is allowed to idle for 5 minutes before and between performance tests of all applications. This is repeated 5 times which accounts for garbage collection; and
- CLEANUP – The entire SSD is written with zero data at a write size of 128KB
In reading the results, the Degrade and Steady State phases represent heavy workload testing while the recovery phase represents typical consumer light workload testing.
As you can see, performance is recorded in terms of Bandwidth and Latency. Bandwidth (or throughput) represents the total throughput the drive is able to sustain during the tests during each phase. Latency, at least for the purposes of PCMark 8, takes on a different outlook and for this, we will term it ‘Total Storage Latency’. Typically, latency has been addressed as the time it takes for a command to be executed, or rather, the time from when the last command completed to the time that the next command started. This is shown below as ‘Average Latency’.
PCMark 8 provides a slightly different measurement, however, that we are terming as ‘Total Storage Latency’. This is represented as being the period from the time the last command was completed, until the time it took to complete the next task; the difference of course being that the execution of that task is included in ‘Total Storage Latency’. For both latency graphs, the same still exists where the lower the latency, the faster the responsiveness of the system will be. While both latency charts look very similar, the scale puts into perspective how just a few milliseconds can increase the length of time to complete multiple workloads.
For a more in-depth look into Latency, Bandwidth, and IOPS check out our primer article on them here.
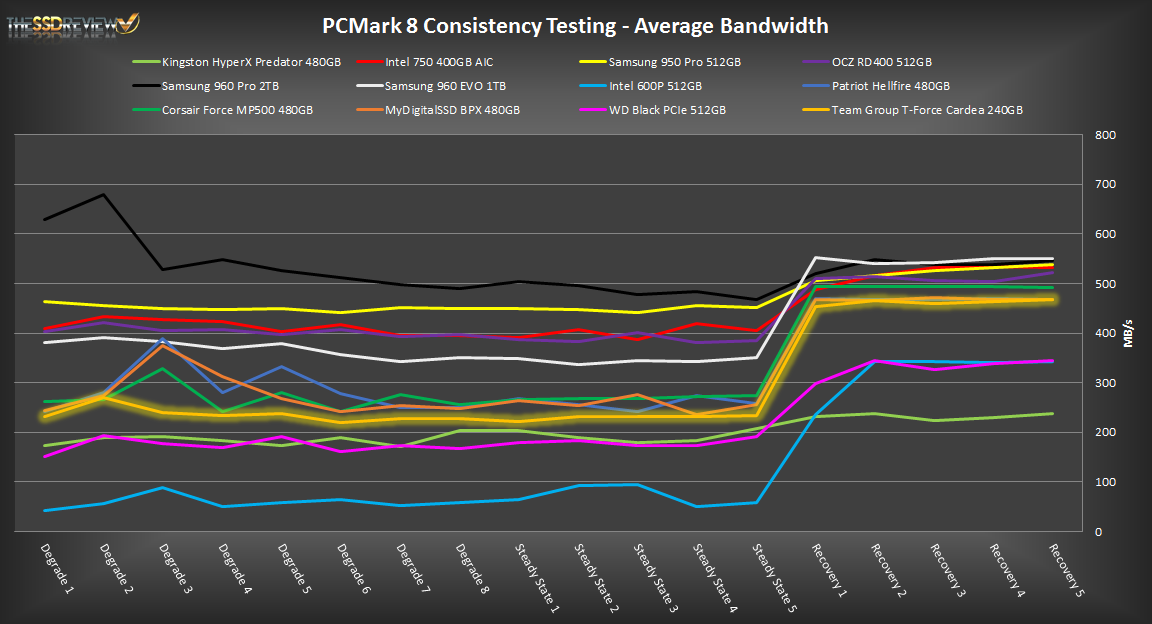
AVERAGE BANDWIDTH (OR THROUGHPUT)
These results show the total average bandwidth across all tests in the 18 phases. In this graph the higher the result the better.
AVERAGE LATENCY (OR ACCESS TIME)
These results show the average access time during the workloads across all tests in the 18 phases. In this graph the lower the result the better.
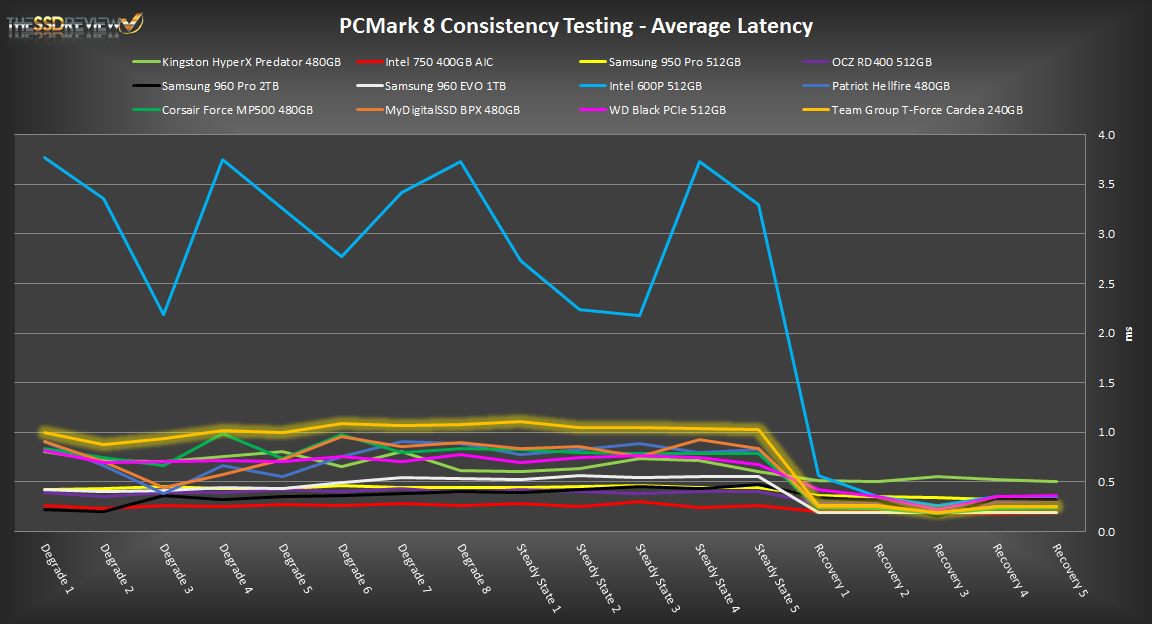
When comparing to other similar SSDs in PCMark 8, the Team Group T-Force Cardea sat in the middle of the pack for throughput but was a bit high in latency when under a heavy load. That seemed to have corrected itself when the SSD was moved into recovery mode and garbage collection was back in place
REAL WORLD FILE TRANSFER
We also wanted to see how performance was in a real-world use when transferring large files to the SSD. For this test, we are going to simply stress write performance by transferring over a 30GB folder of movies off of a 512GB Samsung 950 Pro to the test SSDs and time how long it takes. Once complete we can calculate the average speed.
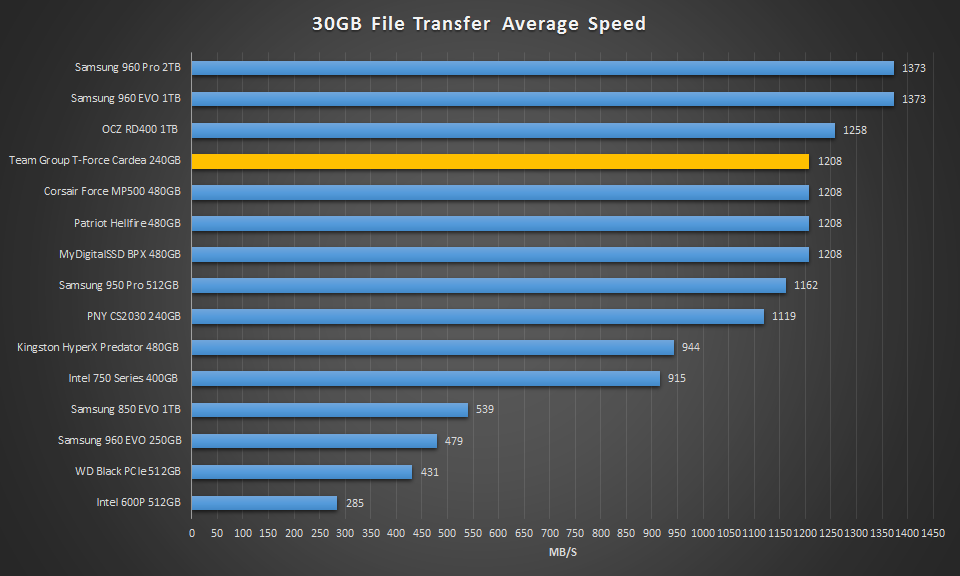
When testing in real-world file transfer, the Cardea did rather well surpassing many of its brethren and coming less than 200MB/s under the leading Samsung 960 Pro.
I use thermal pads from SIlverstone and I also stream constantly from Samsung 950s and since using these have had no throttling issues.
My apps use buffers in RAM that seek targets on the M.2/SSD.
Every time I hit a note on my 88 Note Synth Controller the storage device starts streaming.
So they get a huge workout.
I was throttling down to PCI-e 2X speeds of 785MBps and since using the thermal pads and a Dynatron side firing Fan my speeds are stable and fast.
Back up to 235,000 iops and 2000+ MBps.
Like the Cardea though. Tried to get them at Newegg a while back but got tired of waiting.
Nice review Les, thanks.
https://postimg.org/image/471nqz39n/
https://postimg.org/image/ktg21rpm9/