
8KB RANDOM READ/WRITE
To measure 8KB random read/write performance do the same preconditioning as we did for 4KB performance. The drive is first secure erased to get it in a clean state. Next, the drive is filled by sequentially writing to the RAW NAND capacity twice. We then precondition the drive with 8KB random writes at QD256 until the drive is in a steady state. Finally, we cycle through QD1-256 for 5 minutes each for writes and then reads. All this is scripted to run with no breaks in between. The last hour of preconditioning, the average IOPS, and average latency for each QD is graphed below.
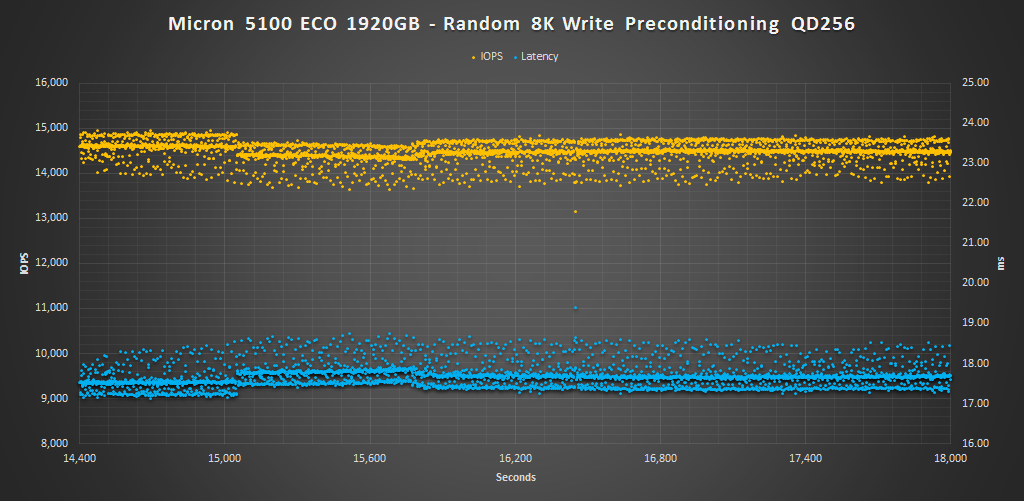
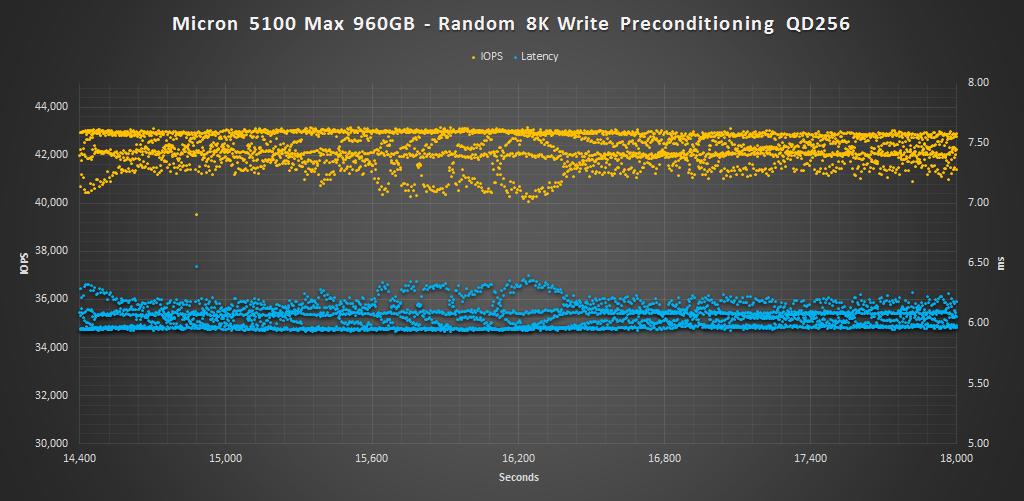
The 8K write preconditioning results follow similar to that of the 4K results. Here we can see a performance distribution of about 1K IOPS for the 5100 ECO and 2K IOPS for the 5100 MAX. The 5100 ECO averaged approximately 14.5K and the 5100 MAX averaged just over 40K.
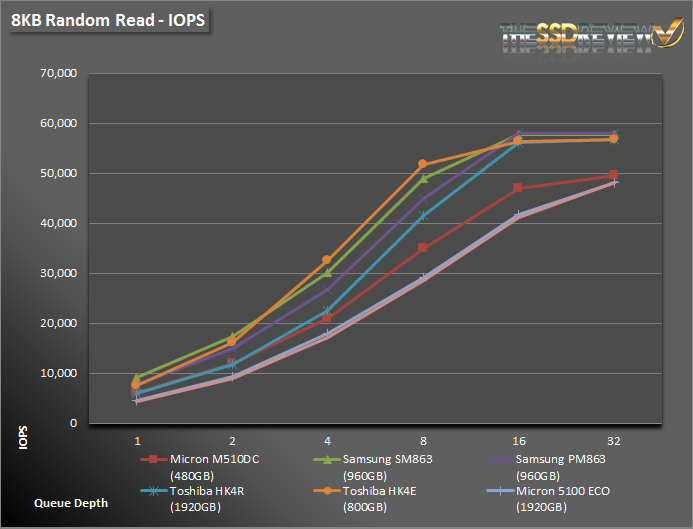
Just as before during the 4K read test, the new Micron 5100 SSDs are at a disadvantage. Most of the other SSDs in the comparison show better performance here.
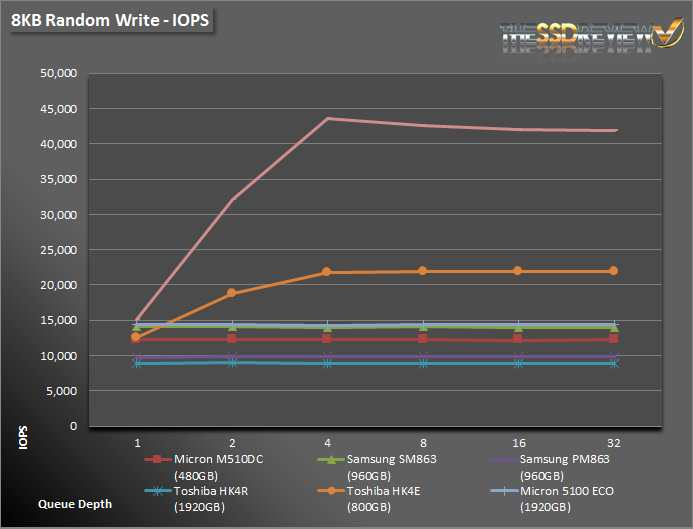
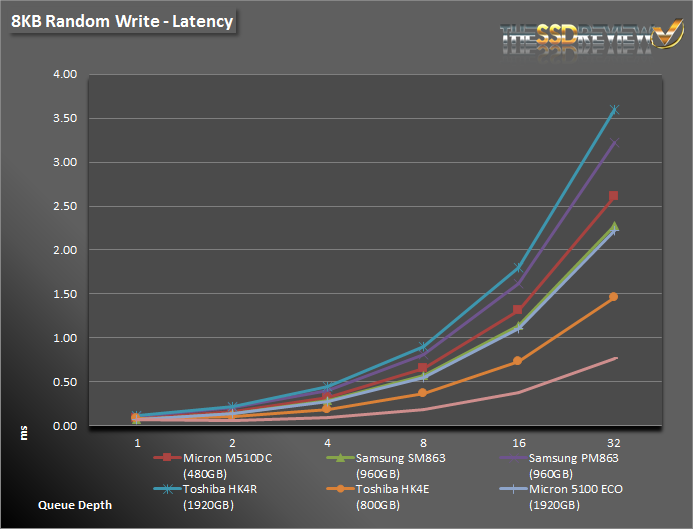
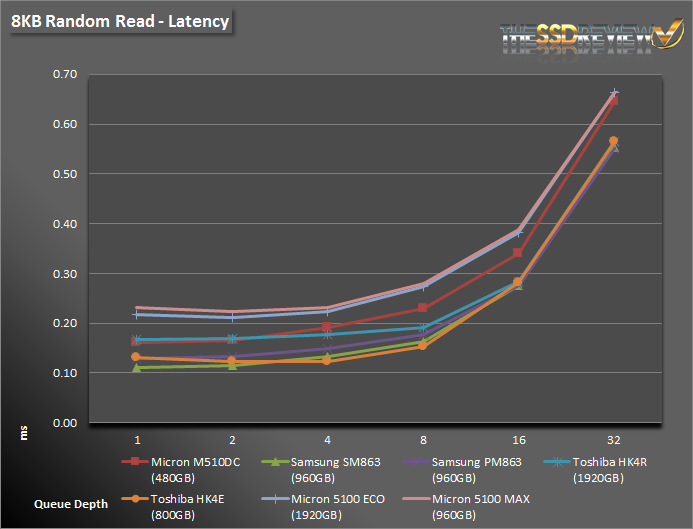
Writes, however, prove yet again to be a very strong point for the Micron 5100 MAX. It destroys the competition and latency remains under 1ms at QD32. The 5100 ECO also ties with the Samsung PM863.