
The SSD Review uses benchmark software called PCMark Vantage x64 HDD Suite to create testing scenarios that might be used in the typical user experience. There are eight tests in all and the tests performed record the speed of data movement in MB/s to which they are then given a numerical score after all of the tests are complete. The simulations are as follows:
- Windows Defender In Use
- Streaming Data from storage in games such as Alan Wake which allows for massive worlds and riveting non-stop action
- Importing digital photos into Windows Photo Gallery
- Starting the Vista Operating System
- Home Video editing with Movie Maker which can be very time consuming
- Media Center which can handle video recording, time shifting and streaming from Windows media center to an extender such as Xbox
- Cataloging a music library
- Starting applications
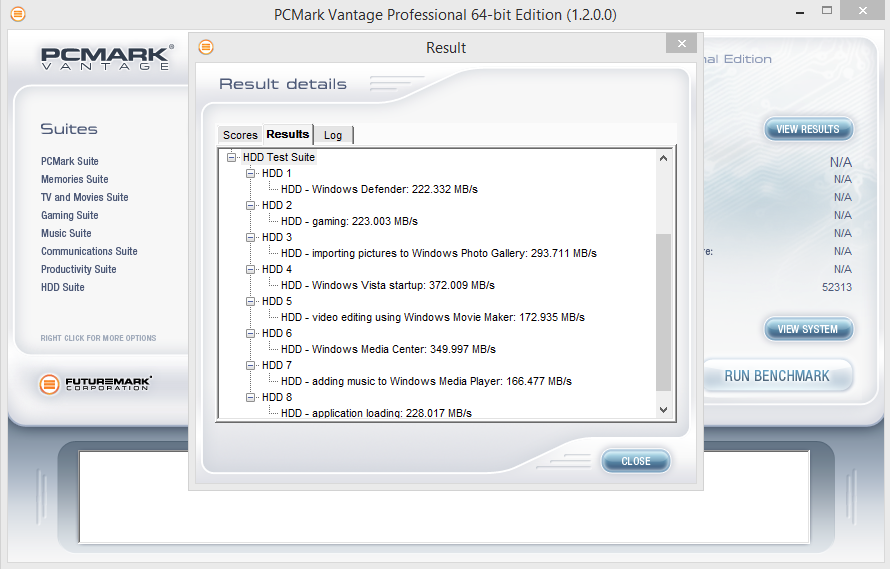
PCMARK VANTAGE RESULTS
Now that we have seen how the HyperX Savage performed in our synthetic tests, it is about time we put it through PCMark to see how it does in more real world usage scenarios and stacks up compared to the competition. The Kingston HyperX Savage 240GB SSD achieved a Total Score of just 52,313 points. The highest transfer speed of 372MB/s was recorded during the “Windows Vista Startup” benchmark. The lowest of 166MB/s was recorded during the “adding music to Windows Media Player” benchmark. Overall, these are some surprising results, we were expecting something much better and to be on par with the Corsair Neutron XT. This performance is more in line with what the Patriot Ignite achieved as most speeds are below 300MB/s. Let’s move on to PCMark 8 and see what it reveals.
For our last benchmark, we have decided to use PCMark 8 Extended Storage Workload in order to determine steady state throughput of the SSD. This software is the longest in our battery of tests and takes just under 18 hours per SSD. As this is a specialized component of PCMark 8 Professional, its final result is void of any colorful graphs or charts typical of the normal online results and deciphering the resulting excel file into an easily understood result takes several more hours.
There are 18 phases of testing throughout the entire run, 8 runs of the Degradation Phase, 5 runs of the Steady State Phase and 5 runs of the Recovery Phase. In each phase, several performance tests are run of 10 different software programs; Adobe After Effects, Illustrator, InDesign, Photoshop Heavy and Photoshop Light, Microsoft Excel, PowerPoint and Word, as well as Battlefield 3 and World of Warcraft to cover the gaming element.
- PRECONDITIONING -The entire SSD is filled twice sequentially with random data of a 128KB file size. The second run accounts for overprovisioning that would have escaped the first;
- DEGRADATION PHASE – The SSD is hit with random writes of between 4KB and 1MB for 10 minutes and then a single pass performance test is done of each application. The cycle is repeated 8 times, and with each time, the duration of random writes increases by 5 minutes;
- STEADY STATE PHASE – The drive is hit with random writes of between 4KB and 1MB for 45 minutes before each application is put through a performance test. This process is repeated 5 times;
- RECOVERY PHASE – The SSD is allowed to idle for 5 minutes before and between performance tests of all applications. This is repeated 5 times which accounts for garbage collection; and
- CLEANUP – The entire SSD is written with zero data at a write size of 128KB
In reading the results, the Degrade and Steady State phases represent heavy workload testing while the recovery phase represents typical consumer light workload testing.
As you can see, performance is recorded in terms of Bandwidth and Latency. Bandwidth (or throughput) represents the total throughput the drive is able to sustain during the tests during each phase. Latency, at least for the purposes of PCMark 8, takes on a different outlook and for this, we will term it ‘Total Storage Latency’. Typically, latency has been addressed as the time it takes for a command to be executed, or rather, the time from when the last command completed to the time that the next command started. This is shown below as ‘Average Latency’.
PCMark 8 provides a slightly different measurement, however, that we are terming as ‘Total Storage Latency’. This is represented as being the period from the time the last command was completed, until the time it took to complete the next task; the difference of course being that the execution of that task is included in ‘Total Storage Latency’. For both latency graphs, the same still exists where the lower the latency, the faster the responsiveness of the system will be. While both latency charts look very similar, the scale puts into perspective how just a few milliseconds can increase the length of time to complete multiple workloads.
For a more in-depth look into Latency, Bandwidth, and IOPS check out our primer article on them here.
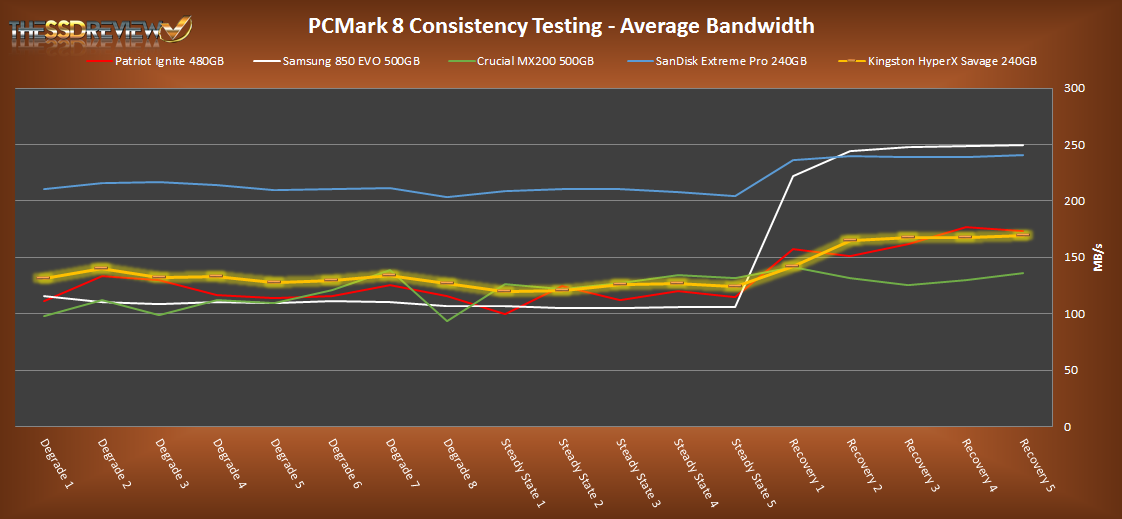
AVERAGE BANDWIDTH (OR THROUGHPUT)
These results show the total average bandwidth across all tests in the 18 phases. In this graph the higher the result the better.
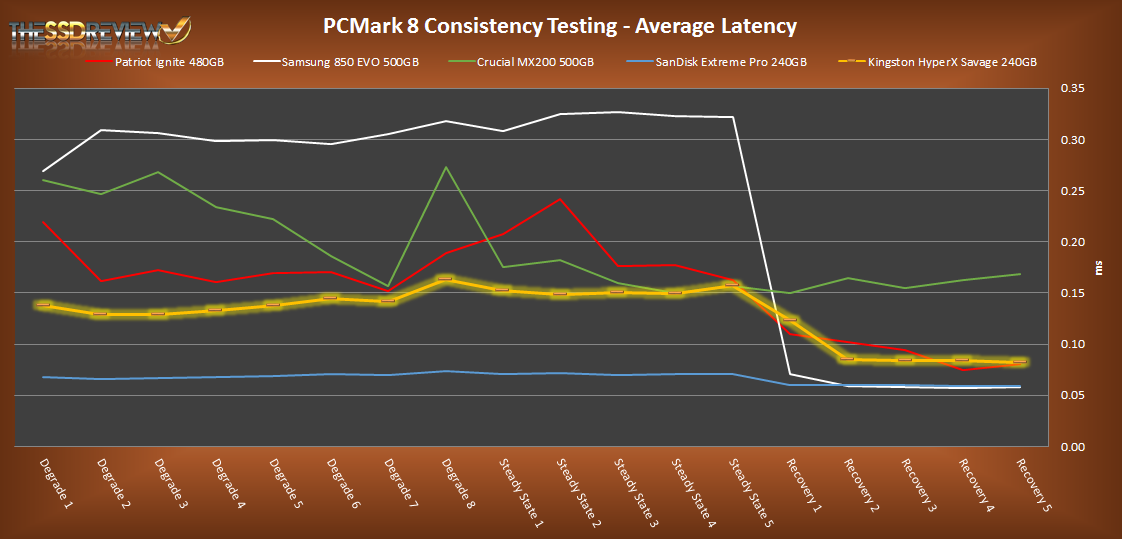
AVERAGE LATENCY (OR ACCESS TIME)
These results show the average access time during the workloads across all tests in the 18 phases. In this graph the lower the result the better.
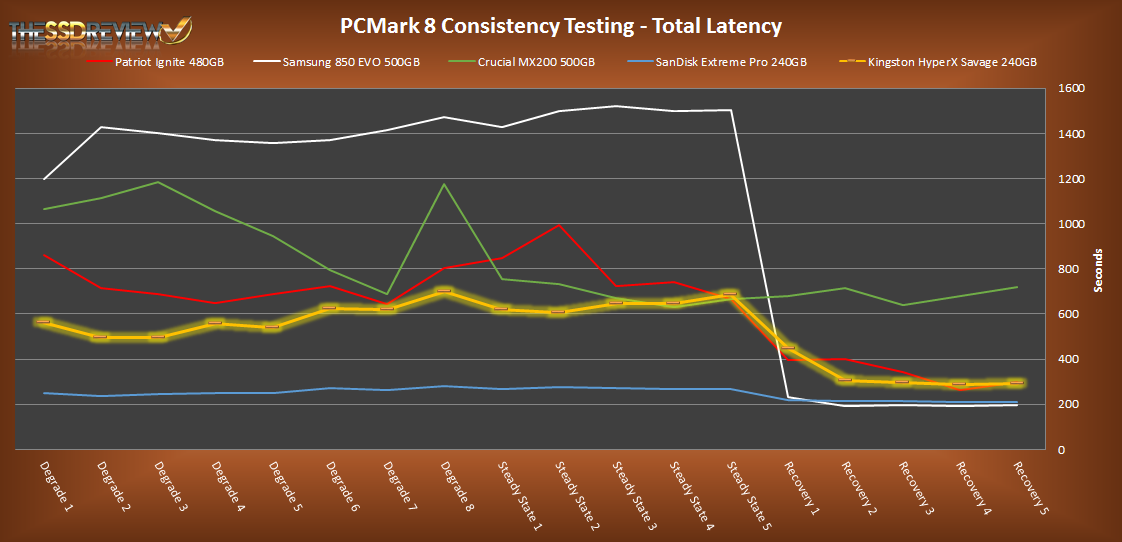
TOTAL STORAGE LATENCY
These results show the total access time across all tests in the 18 phases. In this graph the lower the result the better.
 In our PCMark 8 consistency testing the HyperX Savage 240GB SSD fairs well. As we can see, performance is on par with some of the popular mid-tier SSDs. Under heavy workloads it even beats out the competition, save for the high-end SanDisk Extreme Pro. When it comes to light workload performance in the recovery phase we can see that performance increase during the second phase to where it is just slightly slower than the Samsung 850 EVO and SanDisk Extreme Pro. Overall, it is similar to the Patriot Ignite. This benchmark further validates this SSDs market position.
Thats gonna be a really though sell compared to 850evo, considering it costs almost as much as 850pro. And 850pro is king in sata6g space.
Kingston should have done better than this. Atleast use cheaper nand, if nothing else.
If history is any indication Kingston will end up using that cheaper NAND down the road but just not tell us. 🙂
A couple of other sites just came out with less positive reviews and they also address the yet to be fixed performance issue.
This is the beauty of independent reviews; one has the opportunity to compare several reports before purchase. As for our analysis, we try to paint the picture exactly as our testing portrays it and, especially when looking at PCMark 8, one needs to realize that the SSD just survived 18-22 hours of the hardest testing it will ever see, testing not intended for a typical consumer solution. It might be somewhat comparable to trying to put a Mustang through the Baja 1000 off road circuit.
OK so I was looking randomly at this review and saw your avatar!
I found my match!! hello there 😀
Hello there 🙂
I want that screwdriver!!
It looks awfully kitschy ? but it’s a decent SSD drive.