
ATTO Disk Benchmark is perhaps one of the oldest benchmarks going and is definitely the main staple for manufacturer performance specifications. ATTO uses RAW or compressible data and, for our benchmarks, we use a set length of 256mb and test both the read and write performance of various transfer sizes ranging from 0.5 to 8192kb. Manufacturers prefer this method of testing as it deals with raw (compressible) data rather than random (includes incompressible data) which, although more realistic, results in lower performance results.
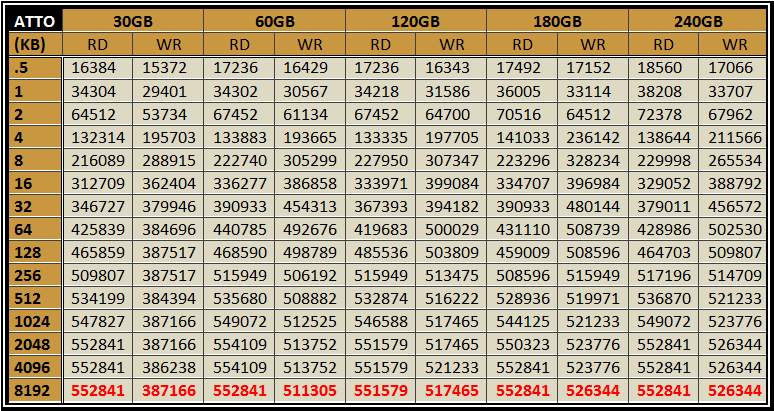
The two charts below reflect the Intel specifications for testing with compressible data, followed by our results, for all capacities in ATTO Disk Benchmark.
COMPRESSIBLE DATA SPECIFICATIONS
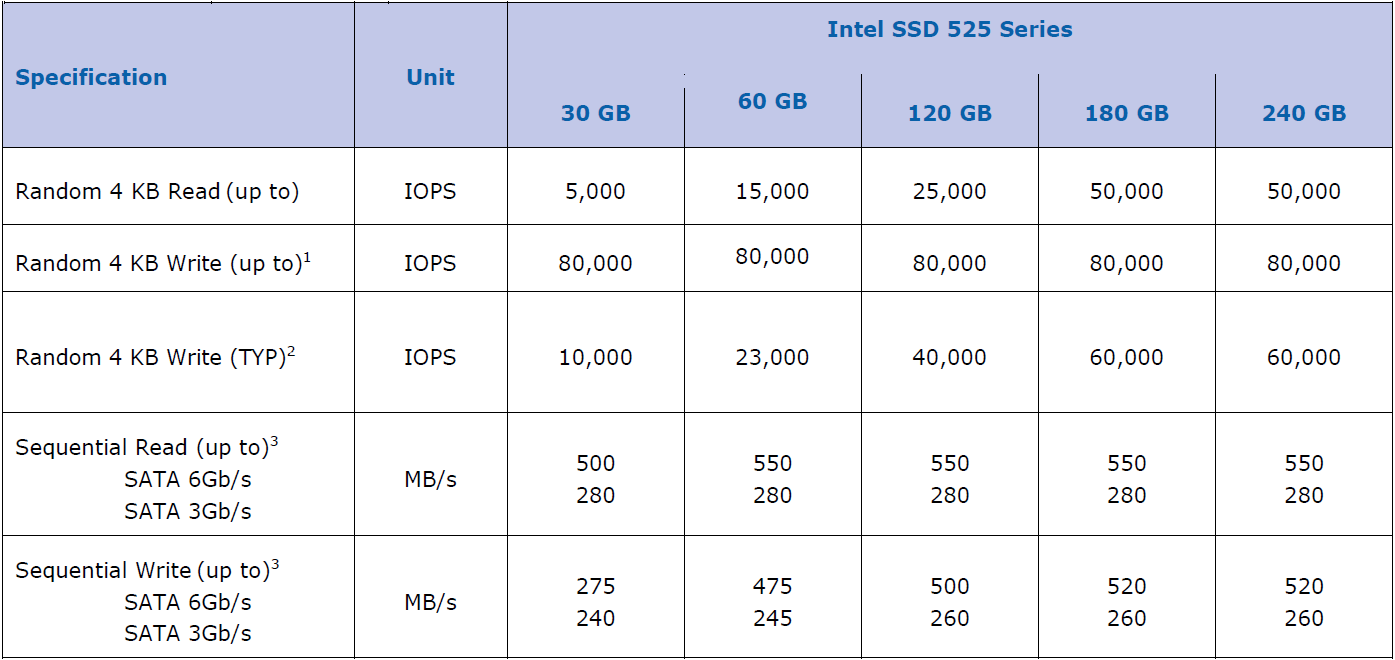
For those not too familiar with ATTO, all results are measured in MB/s and the bottom line displaying the red text results reflects the high sequential read and write of all drives. In all cases, our benchmark exceeded listed specifications and some time significantly, as can be seen with the 30GB performance of 552MB/s read and 387MB/s write compared to listed specifications of 500MB/s read and 275MB/s write performance.
CRYSTAL DISK BENCHMARK VER. 3.0 X64
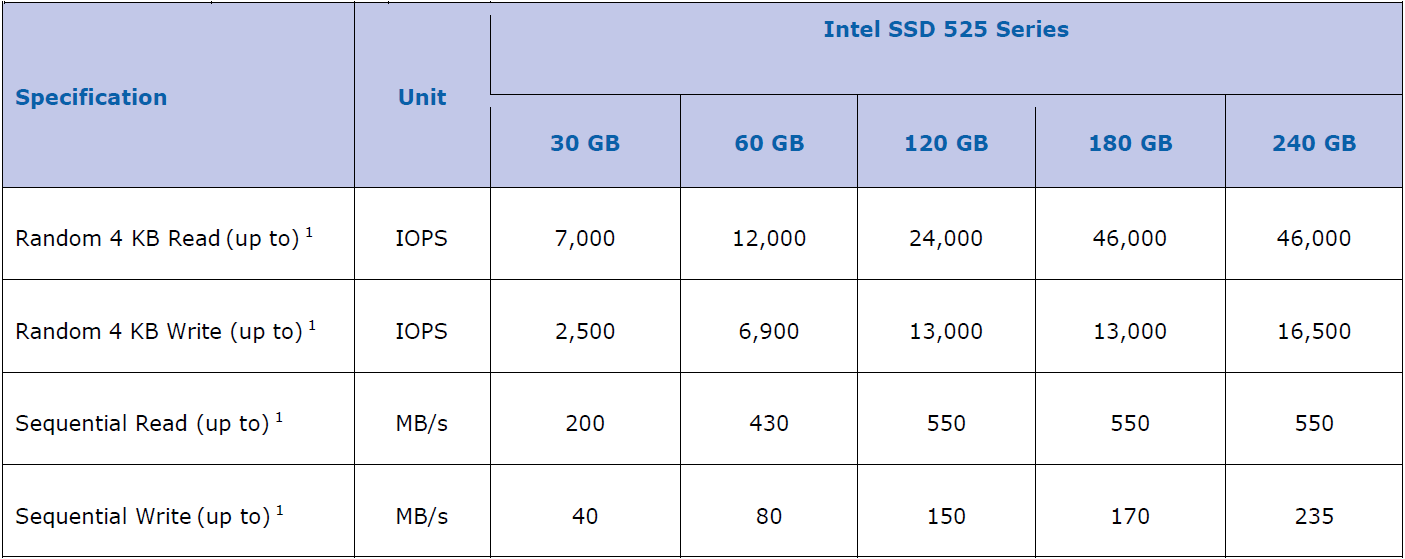
Crystal Disk Benchmark is used to measure read and write performance through sampling of highly compressible data (oFill/1Fill), or random data which is, for the most part, incompressible. We have tested all capacities of the Intel 525 mSATA SSD utilizing both compressible and incompressible data, the results of which are displayed in the chart below. AS a means of comparison, we have provided Intel’s Incompressible Data Specifications here, as we had the Compressible Data Specifications above.
INCOMPRESSIBLE DATA SPECIFICATIONS
Crystal DiskMark traditionally results in scores below that of ATTO, for the most part, because of the composition of data being tested. Conversely, we also often see Crystal DiskMark provide results below manufacturers specifications, especially in testing with incompressible data.
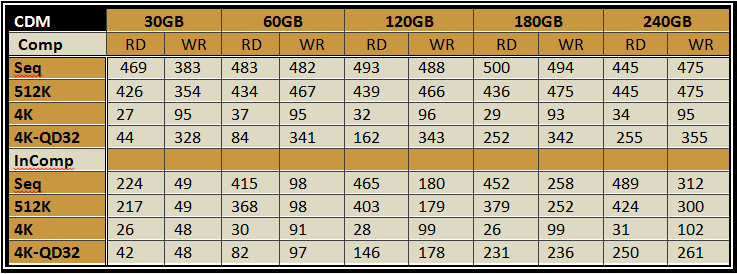 One thing that did stand out was the low 4k random write result of 102MB/s for the 240GB drive when testing with incompressible data samples. This an impressive transfer speeds as a low 4K random write result and one that we don’t see often.
This chart also provides a birds eye view of performance differences observed with different capacity SSDs, especially when testing with incompressible data. Observing the performance results of the all capacities as they increase, so too does the performance increase quite significantly. In fact, if we compare the incompressible high sequential write result of the 30GB capacity to that of the 240GB, we can see that performance of ther 240GB has increased by more than 6 times.
Which brand and model of mSATA to SATA did Intel supply?
It is just a generic adapter with the Intel name on it and is not available for purchase that I am aware of.
That is all nice but Mushkin is shipping a 480 GB mSATA that will outperform any of the Intel drives.
Wanna buy my first ssd and I’ m going crazy with all those bench.
Which one would be better between an old samsung 830 64gb and an intel 525 30gb for my T420 with Ubuntu? – I already have a 500gb hdd in ultrabay for storage –
According to various sites benchmarks, the first one seems to have better performance in heavy/light workload 2011 write test, the second one is way better in desktop iometer 4k random write…