
The SSD Review uses benchmark software called PCMark Vantage x64 HDD Suite to create testing scenarios that might be used in the typical user experience. There are eight tests in all and the tests performed record the speed of data movement in MB/s to which they are then given a numerical score after all of the tests are complete. The simulations are as follows:
- Windows Defender In Use
- Streaming Data from storage in games such as Alan Wake which allows for massive worlds and riveting non-stop action
- Importing digital photos into Windows Photo Gallery
- Starting the Vista Operating System
- Home Video editing with Movie Maker which can be very time consuming
- Media Center which can handle video recording, time shifting and streaming from Windows media center to an extender such as Xbox
- Cataloging a music library
- Starting applications
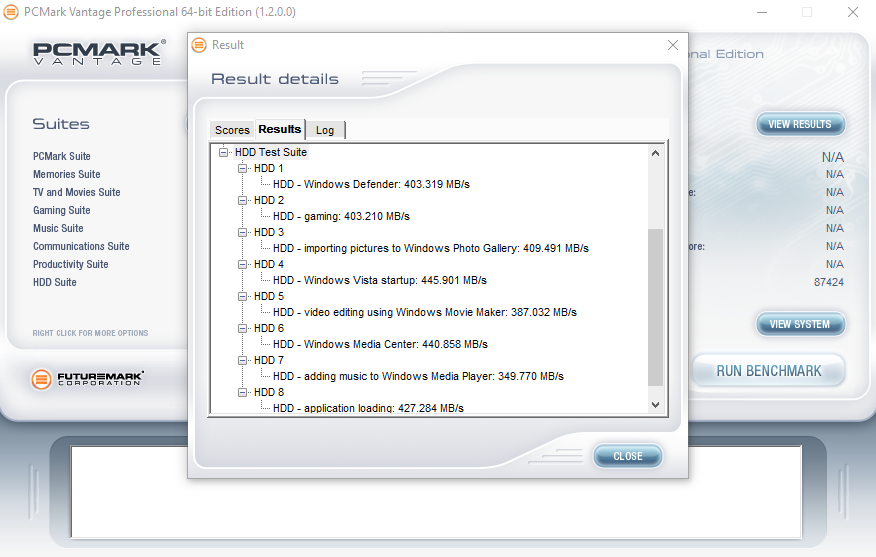
PCMARK VANTAGE RESULTS
The Intel 540s Series delivers a very good score of 87424 points in PCMark Vantage. Most benchmark speeds exceeded 400MB/s with the high spped being 445MB/s in the Windows Vista start up benchmark and lowest in the Windows Media Player benchmark at 349MB/s. These are all very good results! Next, let’s see how well it compares in our PCMark 8 extended testing. Will it perform just as well?
For our last benchmark, we have decided to use PCMark 8 Extended Storage Workload in order to determine steady state throughput of the SSD. This software is the longest in our battery of tests and takes just under 18 hours per SSD. As this is a specialized component of PCMark 8 Professional, its final result is void of any colorful graphs or charts typical of the normal online results and deciphering the resulting excel file into an easily understood result takes several more hours.
There are 18 phases of testing throughout the entire run, 8 runs of the Degradation Phase, 5 runs of the Steady State Phase and 5 runs of the Recovery Phase. In each phase, several performance tests are run of 10 different software programs; Adobe After Effects, Illustrator, InDesign, Photoshop Heavy and Photoshop Light, Microsoft Excel, PowerPoint and Word, as well as Battlefield 3 and World of Warcraft to cover the gaming element.
- PRECONDITIONING -The entire SSD is filled twice sequentially with random data of a 128KB file size. The second run accounts for overprovisioning that would have escaped the first;
- DEGRADATION PHASE – The SSD is hit with random writes of between 4KB and 1MB for 10 minutes and then a single pass performance test is done of each application. The cycle is repeated 8 times, and with each time, the duration of random writes increases by 5 minutes;
- STEADY STATE PHASE – The drive is hit with random writes of between 4KB and 1MB for 45 minutes before each application is put through a performance test. This process is repeated 5 times;
- RECOVERY PHASE – The SSD is allowed to idle for 5 minutes before and between performance tests of all applications. This is repeated 5 times which accounts for garbage collection; and
- CLEANUP – The entire SSD is written with zero data at a write size of 128KB
In reading the results, the Degrade and Steady State phases represent heavy workload testing while the recovery phase represents typical consumer light workload testing.
As you can see, performance is recorded in terms of Bandwidth and Latency. Bandwidth (or throughput) represents the total throughput the drive is able to sustain during the tests during each phase. Latency, at least for the purposes of PCMark 8, takes on a different outlook and for this, we will term it ‘Total Storage Latency’. Typically, latency has been addressed as the time it takes for a command to be executed, or rather, the time from when the last command completed to the time that the next command started. This is shown below as ‘Average Latency’.
PCMark 8 provides a slightly different measurement, however, that we are terming as ‘Total Storage Latency’. This is represented as being the period from the time the last command was completed, until the time it took to complete the next task; the difference of course being that the execution of that task is included in ‘Total Storage Latency’. For both latency graphs, the same still exists where the lower the latency, the faster the responsiveness of the system will be. While both latency charts look very similar, the scale puts into perspective how just a few milliseconds can increase the length of time to complete multiple workloads.
For a more in-depth look into Latency, Bandwidth, and IOPS check out our primer article on them here.
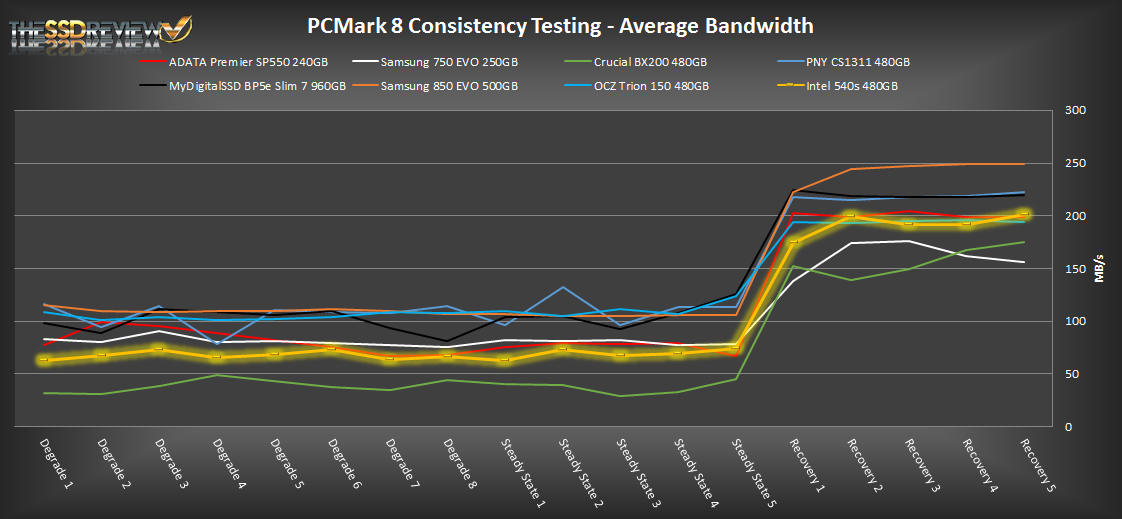
AVERAGE BANDWIDTH (OR THROUGHPUT)
These results show the total average bandwidth across all tests in the 18 phases. In this graph the higher the result the better.
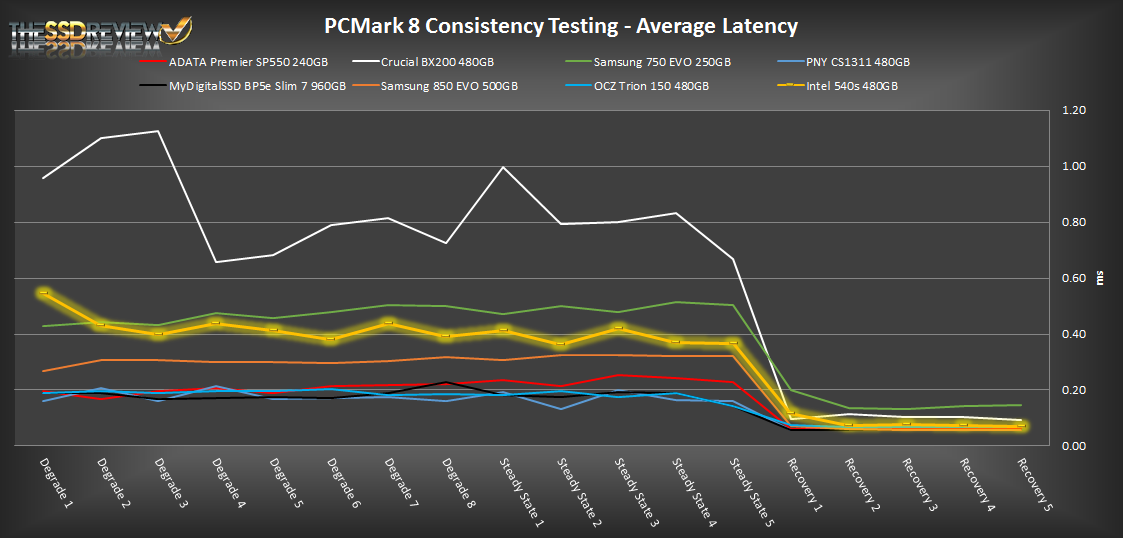
AVERAGE LATENCY (OR ACCESS TIME)
These results show the average access time during the workloads across all tests in the 18 phases. In this graph the lower the result the better.
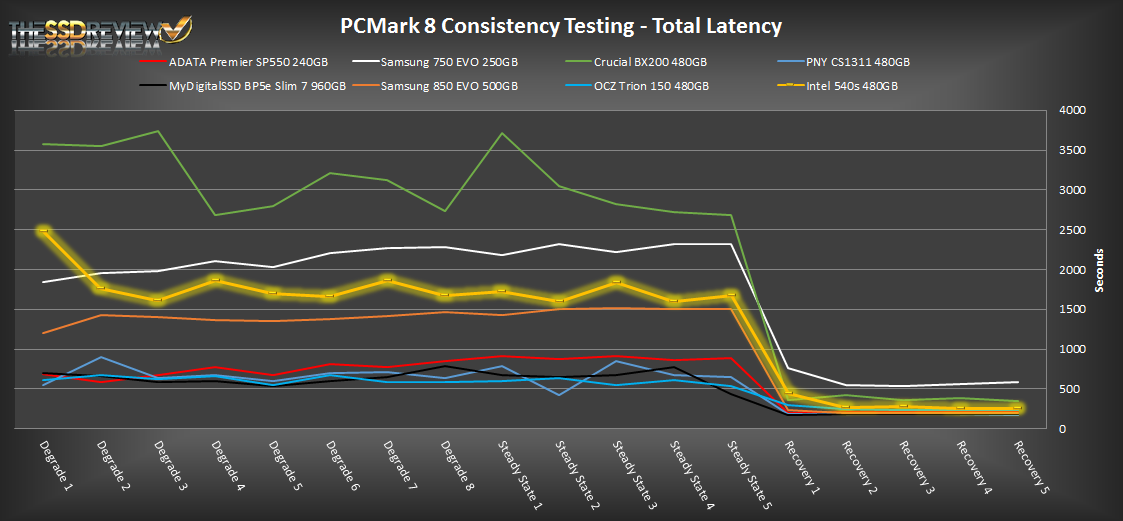
TOTAL STORAGE LATENCY
These results show the total access time across all tests in the 18 phases. In this graph the lower the result the better.
In our PCMark 8 consistency testing the Intel 540s does seem to fair well. We can see that it delivers better performance than that of the Samsung 750 EVO and Crucial BX200 and, during recovery periods, it is on par with many of the other mid-performing TLC SSDs. Overall, performance shows to be very consistent through the Degrade and Steady State phases after the first Degrade pass, but as xpected, performance jumps in the recovery section.
>ut why Intel would not be relying on their own fabs for memory is more than a bit curious.
Not really. Intel didn’t invest in 16nm NAND, so they have to source it somewhere else to be price competitive.
It is the bigger question with respect to memory in Intel’s future that we elude to…just adding an air of suspense. lol
Guess-Just a stop-gap until they can get their 3D out..
They couldn’t go to their partner Micron-their TLC is borderline LEMON.
For the average Joe that don’t regularly transfer large files-as long as it’s responsive enough it’ll be fine.
TLC has benefited us all-bringing down the cost of owning a SSD.
The sooner everyone goes 3D can’t come quick enough-we can then send planer TLC into history………………………………………….
I cant understatnd the overprovisioning. The drive is RAW 512GiB, usable space is 480GB, it means 447GiB. How do You calculate 7%. There is 7% overprovisioning and another 7% is gone. please use proper GiB and GB then everything will be clear.
Trying to explain the difference between GB and GiB to the typical person wanting this drive would make the report extremely confusing and would serve no purpose but to turn away the reader. GiB has no purpose in a consumer/client report and, IMO, really has no place whatsoever in current day reports, regardless of the target audience intended. Thanks for the input!
Easiest way to explain GB and GIB is that they are my initials 🙂
Keep smiling
Actually, internally NAND dies are even bigger than 128Gbit (so drive even has more than 512GiB flash) but thats just getting way too technical 🙂
Hm, no sequential write speed test all over the capacity?
It would make the drive look bad 🙂
Nothing is harder than the truth 😉
Our report is the same format that we have used for some time and is actually very telling of the drives ability.
Well, on my Laptop with USB2.0 the write speed of the SSD is not that important.
But for some other usecases the sequential write speed with large files is a criteria for me which says: Buy or buy not.
I mean files which are larger than the SLC-caches.
Because that’s a likely use case. /s
In most cases 30GB is enough to see the real write speed with SSDs that uses SLC-Cache-tricks.
It seems that all SSD-manufacturers choose the write cache size which is enough for standard-benchmark-tools.
And yeah, I use SSDs also for my movie-cutting-PC and copy more than 100GB in a row, so it´s a usecase for me
That’s fair, although surely as that’s highly sequential SATA III SSDs over a certain size are going to hit the interface ceiling regardless of the use of TLC?
I guess what I’m getting at is that I’d have thought that if the use case is mission critical and speed is /required/ then the investment in MLC PCIe drives would be justified.
Well, I use external USB3.0-drives to copy my DVB-S(2)-recordings for cutting to my PC. It depends on the external case how fast I can copy. Some TLC-drives like the 850 Evo or Sandisk Ultra 2 offer speed >200MB/s with 500GB/480GB-versions, thats still OK as far I don´t start more than one copy at one time
But TLC-drives like Crucial BX200 which going down to ~75MB/s (960GB-version) are shitty for that usecase
Oh wow. Yeah, that’s a pretty substantial difference and knowing that comparison between drives would obviously be useful. Fair enough!
Incidentally the Crucial MX300 looks like it would be more your style. PC Perspective have a review including full drive writes and latency measurements.
What are the SSD’s better than this for the same price? I don’t have much knowlegde about it and in my country (Brazil) I don’t have too much options…
Sandisk x400 512MB — better performance, lower price.
Samsung 850 EVO 500MB — best performance in class, about the same price.
Nice test: inducted me to buy the 120GB for a Linux-powered netbook given 1. Its idle consumption, 2. Price and 3. Perfs vs HDD.
Before proper set-up (e.g. pcie_ASPM and so on) the little box total consumption was the *same* than with a 5400 Momentus. After set-up, I got a very slightly lower consumption when systems idle. And to my surprise, a 10-15% lower battery consumption when surfing, (or even with just the wireless chipset On and connected) reapeatedly on two OS.