
The SSD Review uses benchmark software called PCMark Vantage x64 HDD Suite to create testing scenarios that might be used in the typical user experience. There are eight tests in all and the tests performed record the speed of data movement in MB/s to which they are then given a numerical score after all of the tests are complete. The simulations are as follows:
- Windows Defender In Use
- Streaming Data from storage in games such as Alan Wake which allows for massive worlds and riveting non-stop action
- Importing digital photos into Windows Photo Gallery
- Starting the Vista Operating System
- Home Video editing with Movie Maker which can be very time consuming
- Media Center which can handle video recording, time shifting and streaming from Windows media center to an extender such as Xbox
- Cataloging a music library
- Starting applications
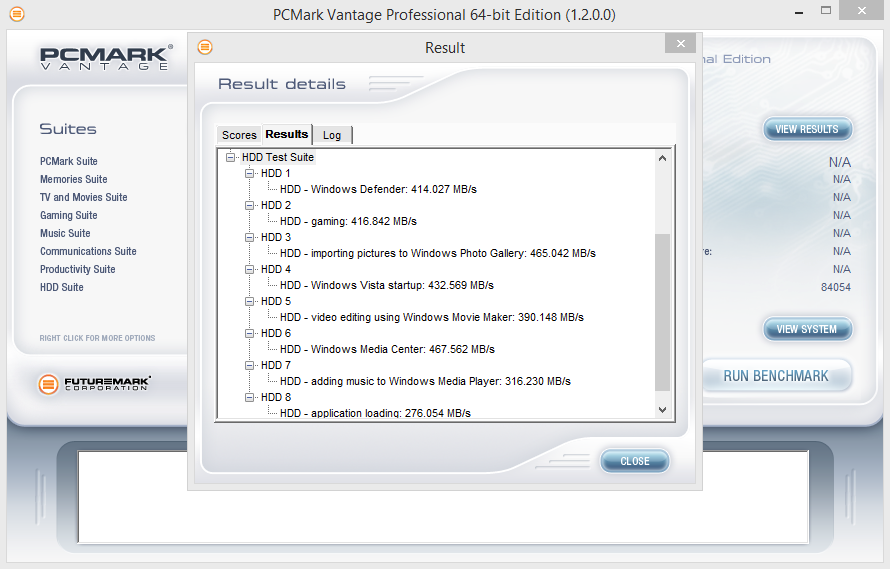
PCMARK VANTAGE RESULTS
The Edge Boost Pro Micro 1TB SSD achieved a Total Score of 84,054 points. The highest transfer speed of 468MB/s was recorded during the “Windows Media Center” benchmark. The lowest of 276MB/s was recorded during the “application loading” benchmark, which isn’t surprising when you compare this result to the AS SSD copy benchmarks from earlier. Overall, these are some great results, most speeds are near or over 400MB/s and it is on par with some of the top 2.5″ SSDs out.
For our last benchmark, we have decided to use PCMark 8 Extended Storage Workload in order to determine steady state throughput of the SSD. This software is the longest in our battery of tests and takes just under 18 hours per SSD. As this is a specialized component of PCMark 8 Professional, its final result is void of any colorful graphs or charts typical of the normal online results and deciphering the resulting excel file into an easily understood result takes several more hours.
There are 18 phases of testing throughout the entire run, 8 runs of the Degradation Phase, 5 runs of the Steady State Phase and 5 runs of the Recovery Phase. In each phase, several performance tests are run of 10 different software programs; Adobe After Effects, Illustrator, InDesign, Photoshop Heavy and Photoshop Light, Microsoft Excel, PowerPoint and Word, as well as Battlefield 3 and World of Warcraft to cover the gaming element.
- PRECONDITIONING -The entire SSD is filled twice sequentially with random data of a 128KB file size. The second run accounts for overprovisioning that would have escaped the first;
- DEGRADATION PHASE – The SSD is hit with random writes of between 4KB and 1MB for 10 minutes and then a single pass performance test is done of each application. The cycle is repeated 8 times, and with each time, the duration of random writes increases by 5 minutes;
- STEADY STATE PHASE – The drive is hit with random writes of between 4KB and 1MB for 45 minutes before each application is put through a performance test. This process is repeated 5 times;
- RECOVERY PHASE – The SSD is allowed to idle for 5 minutes before and between performance tests of all applications. This is repeated 5 times which accounts for garbage collection; and
- CLEANUP – The entire SSD is written with zero data at a write size of 128KB
In reading the results, the Degrade and Steady State phases represent heavy workload testing while the recovery phase represents typical consumer light workload testing.
As you can see, performance is recorded in terms of Bandwidth and Latency. Bandwidth (or throughput) represents the total throughput the drive is able to sustain during the tests during each phase. Latency, at least for the purposes of PCMark 8, takes on a different outlook and for this, we will term it ‘Total Storage Latency’. Typically, latency has been addressed as the time it takes for a command to be executed, or rather, the time from when the last command completed to the time that the next command started. This is shown below as ‘Average Latency’.
PCMark 8 provides a slightly different measurement, however, that we are terming as ‘Total Storage Latency’. This is represented as being the period from the time the last command was completed, until the time it took to complete the next task; the difference of course being that the execution of that task is included in ‘Total Storage Latency’. For both latency graphs, the same still exists where the lower the latency, the faster the responsiveness of the system will be. While both latency charts look very similar, the scale puts into perspective how just a few milliseconds can increase the length of time to complete multiple workloads.
For a more in-depth look into Latency, Bandwidth, and IOPS check out our primer article on them here.
AVERAGE BANDWIDTH (OR THROUGHPUT)
These results show the total average bandwidth across all tests in the 18 phases. In this graph the higher the result the better.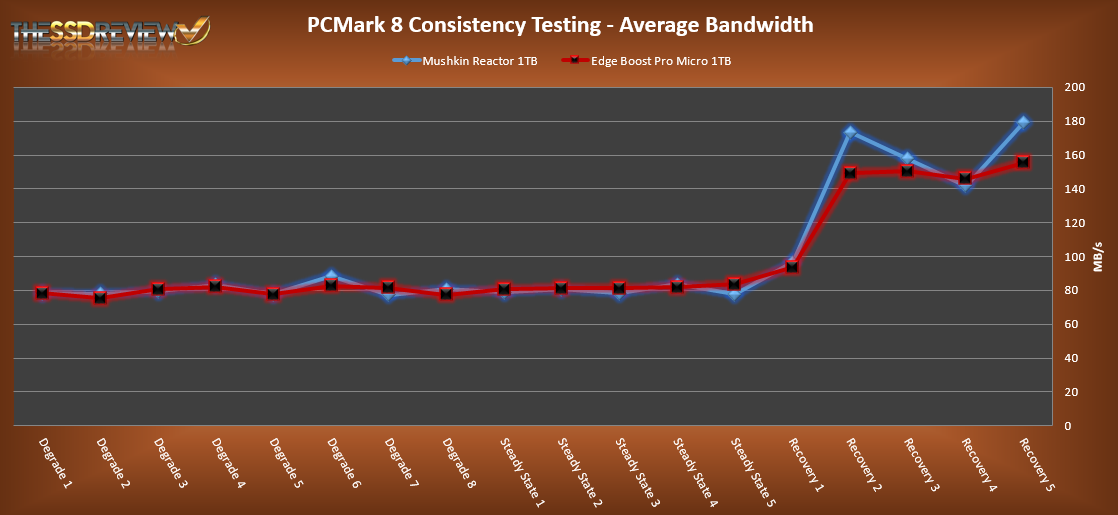
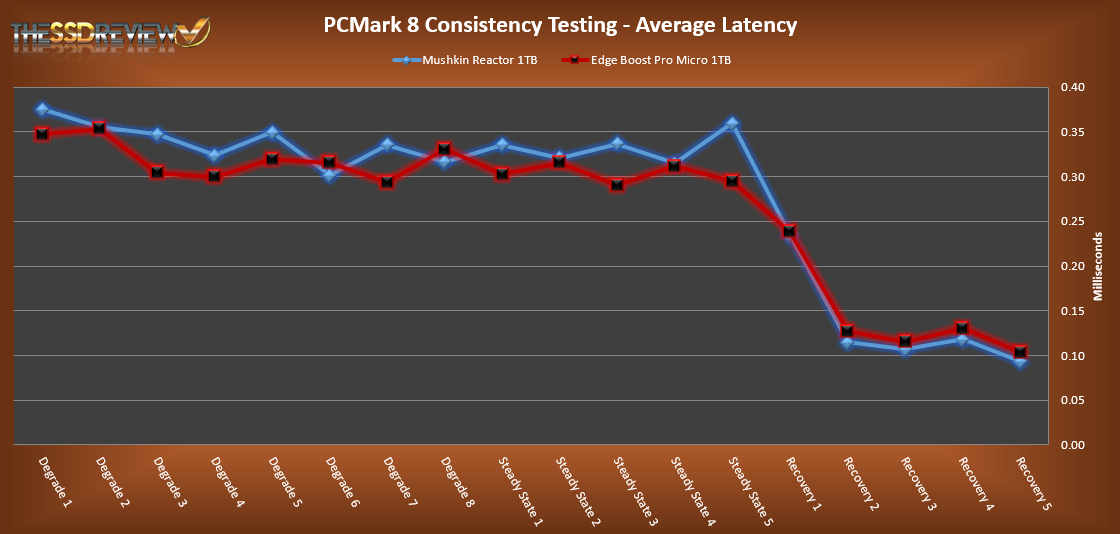
AVERAGE LATENCY (OR ACCESS TIME)
These results show the average access time during the workloads across all tests in the 18 phases. In this graph the lower the result the better.
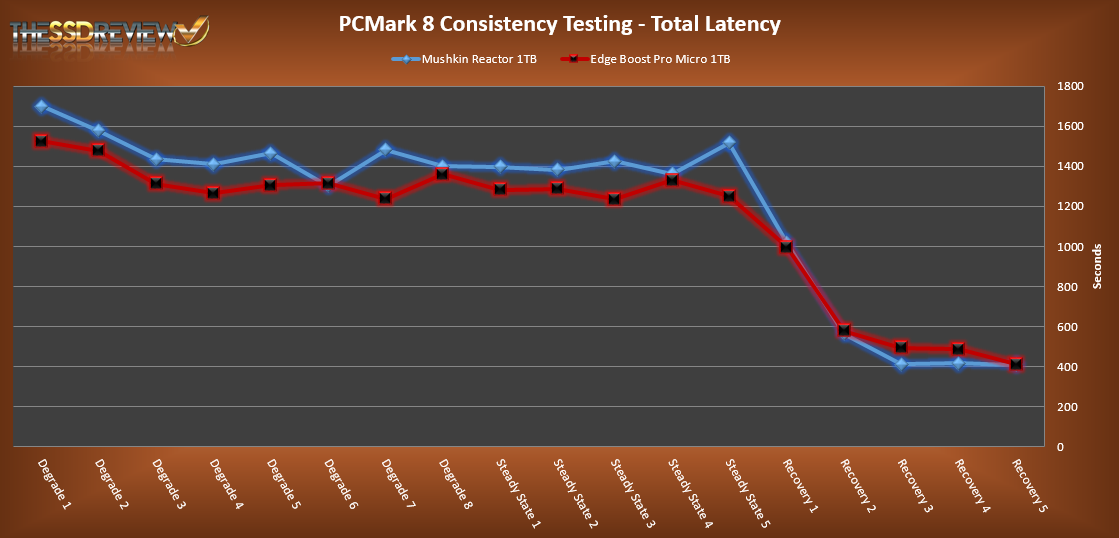
TOTAL STORAGE LATENCY
These results show the total access time across all tests in the 18 phases. In this graph the lower the result the better.
 As a reference we included the results from our Mushkin Reactor 1TB SSD review. As you can see, the Edge Boost Pro Micro 1TB does fairly well, even a bit better than the Mushkin in the heavy workload tests. There is also a big ramp up in performance when the recovery/light workload section begins. Latency in this section stayed in the 0.12ms range and average throughput hovered around 150MB/s. Overall, the performance is that of a client oriented SSD, which is in line with the market this SSD is targeted towards.
If you’re after 1.8″ drives, it would make more sense (from price perspective) to just buy a msata to 1.8″ sata converter card . You can get them for a few dollars off ebay. Much cheaper than buying 800$+ part.
Otherwise its nice to see more manufacturers going away from sandforce to something more respectable like siliconmotion.
Whether 1TB mSATA product of 2bit MLC is cheaper than this?
In sandforce2281, it is not put out 1TB of capacity.
You have 840evo for 360€ using TLC.
Or if you for some reason cant have TLC (you would _really_ need a good reason not to take TLC) apperently there is a M6PRO msata, thats also 1TB (cant find it on their website, but i see it selling for 600€).
840Evo I will exclude from a short life.
MSATA of M6Pro is suspicious information of 1TB product.
Number basis of memory chips, 1TB in 2bit MLC will feel like difficult.
But if M6Pro mSATA 1TB can buy at 600 euros, I likely can rest assured prefer over there.
>Number basis of memory chips, 1TB in 2bit MLC will feel like difficult.
Its not. 256GB MLC packages (so 4 of them makes 1TB) are not that uncommon. 128Gbit dies and 16 of them in a single package is perfectly achieveable with MLC.
>840Evo I will exclude from a short life.
Where are you getting the idea, that 840evo has short life ?
>Where are you getting the idea, that 840evo has short life ?
I’m sorry.
The life was short, it’s a 840.
Certainly I was life test in the Japanese site.
Like 840Evo is, SMART value becomes trough by writing to 171TB position in 120GB. It’s much longer lasting likely to if 1TB.
At 1TB, you’re likely gonna get 1PB of writes, before you even reach smart at 0%. But even when you do reach 0%, its still gonna work just fine, because its just a predetermined value for segmentation purposes.
And you have to have a really good reason to write soo much data.