
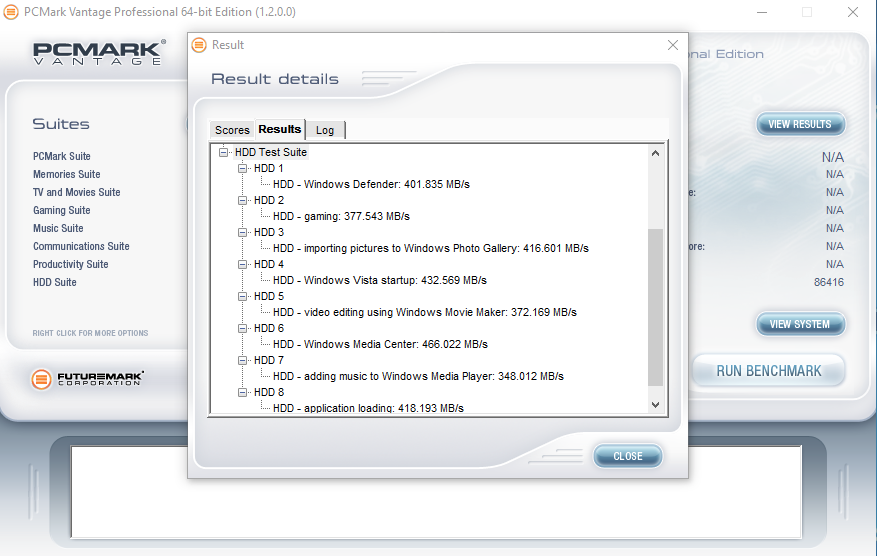
The SSD Review uses benchmark software called PCMark Vantage x64 HDD Suite to create testing scenarios that might be used in the typical user experience. There are eight tests in all and the tests performed record the speed of data movement in MB/s to which they are then given a numerical score after all of the tests are complete. The simulations are as follows:
- Windows Defender In Use
- Streaming Data from storage in games such as Alan Wake which allows for massive worlds and riveting non-stop action
- Importing digital photos into Windows Photo Gallery
- Starting the Vista Operating System
- Home Video editing with Movie Maker which can be very time consuming
- Media Center which can handle video recording, time shifting and streaming from Windows media center to an extender such as Xbox
- Cataloging a music library
- Starting applications
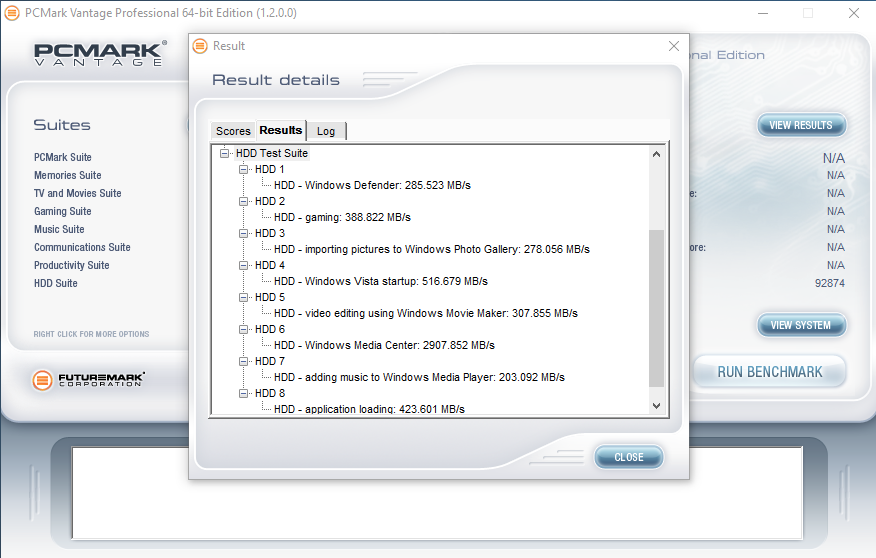
PCMARK VANTAGE RESULTS
As a single drive, the MX300 does well in PCMark Vantage. It reached an overall score of 86K points. When tested in a RAID 0 config, however, performance only improved very slightly to 92K points. Looking to figure out how to improve our score we decided to see just how much the stripe size made a difference. We changed it from 64K to 8K and there was quite a notable improvement. As you can see the score jumped from 92K to 113K points. Thus we can conclude that the best option for standard users is to utilize a smaller stripe size
Single
RAID 0
RAID 0 8K Stripe

PCMARK 8 EXTENDED STORAGE WORKLOAD CONSISTENCY TESTING
For our last benchmark, we have decided to use PCMark 8 Extended Storage Workload in order to determine steady state throughput of the SSD. This software is the longest in our battery of tests and takes just under 18 hours per SSD. As this is a specialized component of PCMark 8 Professional, its final result is void of any colorful graphs or charts typical of the normal online results and deciphering the resulting excel file into an easily understood result takes several more hours.
There are 18 phases of testing throughout the entire run, 8 runs of the Degradation Phase, 5 runs of the Steady State Phase and 5 runs of the Recovery Phase. In each phase, several performance tests are run of 10 different software programs; Adobe After Effects, Illustrator, InDesign, Photoshop Heavy and Photoshop Light, Microsoft Excel, PowerPoint and Word, as well as Battlefield 3 and World of Warcraft to cover the gaming element.
- PRECONDITIONING -The entire SSD is filled twice sequentially with random data of a 128KB file size. The second run accounts for overprovisioning that would have escaped the first;
- DEGRADATION PHASE – The SSD is hit with random writes of between 4KB and 1MB for 10 minutes and then a single pass performance test is done of each application. The cycle is repeated 8 times, and with each time, the duration of random writes increases by 5 minutes;
- STEADY STATE PHASE – The drive is hit with random writes of between 4KB and 1MB for 45 minutes before each application is put through a performance test. This process is repeated 5 times;
- RECOVERY PHASE – The SSD is allowed to idle for 5 minutes before and between performance tests of all applications. This is repeated 5 times which accounts for garbage collection; and
- CLEANUP – The entire SSD is written with zero data at a write size of 128KB
In reading the results, the Degrade and Steady State phases represent heavy workload testing while the recovery phase represents typical consumer light workload testing.
As you can see, performance is recorded in terms of Bandwidth and Latency. Bandwidth (or throughput) represents the total throughput the drive is able to sustain during the tests during each phase. Latency, at least for the purposes of PCMark 8, takes on a different outlook and for this, we will term it ‘Total Storage Latency’. Typically, latency has been addressed as the time it takes for a command to be executed, or rather, the time from when the last command completed to the time that the next command started. This is shown below as ‘Average Latency’.
PCMark 8 provides a slightly different measurement, however, that we are terming as ‘Total Storage Latency’. This is represented as being the period from the time the last command was completed, until the time it took to complete the next task; the difference of course being that the execution of that task is included in ‘Total Storage Latency’. For both latency graphs, the same still exists where the lower the latency, the faster the responsiveness of the system will be. While both latency charts look very similar, the scale puts into perspective how just a few milliseconds can increase the length of time to complete multiple workloads.
For a more in-depth look into Latency, Bandwidth, and IOPS check out our primer article on them here.
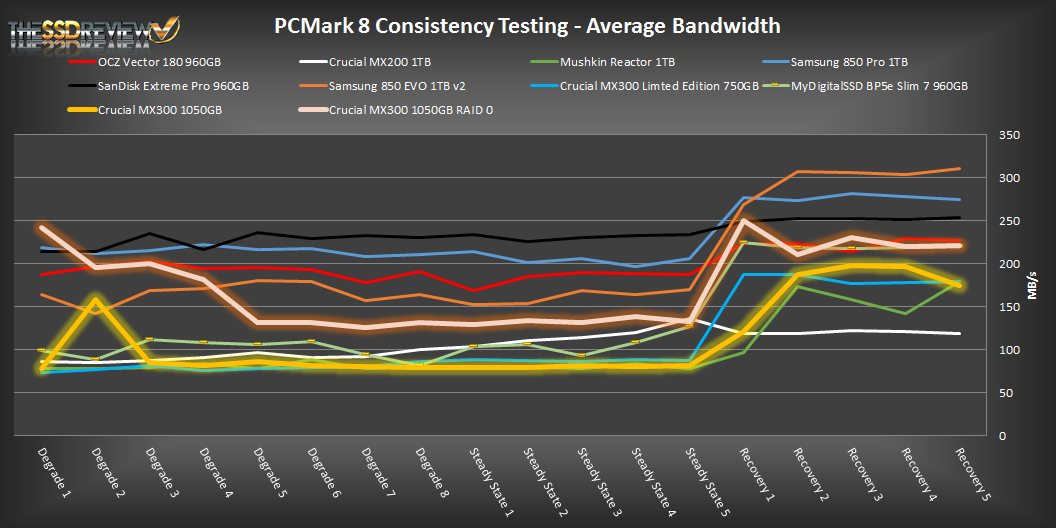
AVERAGE BANDWIDTH (OR THROUGHPUT)
These results show the total average bandwidth across all tests in the 18 phases. In this graph the higher the result the better.
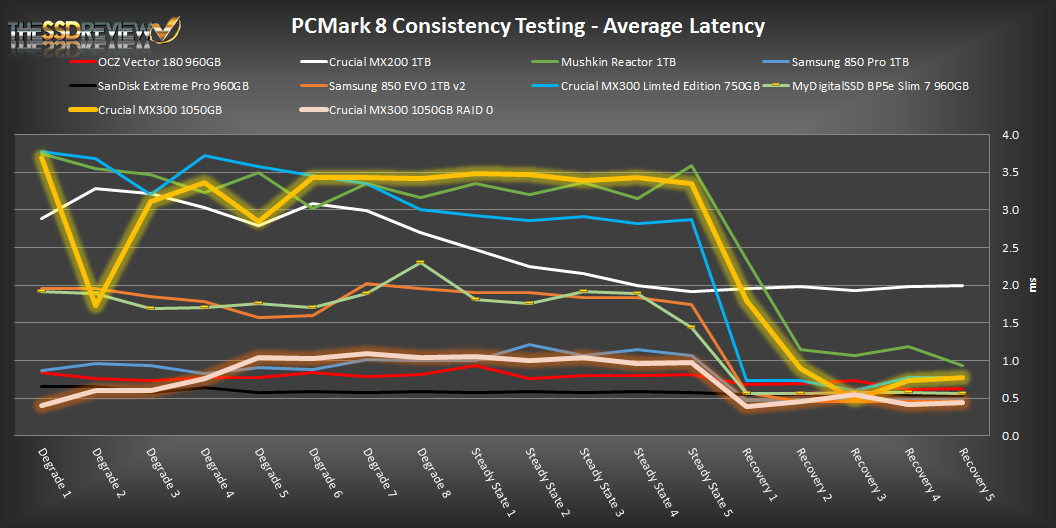
AVERAGE LATENCY (OR ACCESS TIME)
These results show the average access time during the workloads across all tests in the 18 phases. In this graph the lower the result the better.
TOTAL STORAGE LATENCY
These results show the total access time across all tests in the 18 phases. In this graph the lower the result the better.
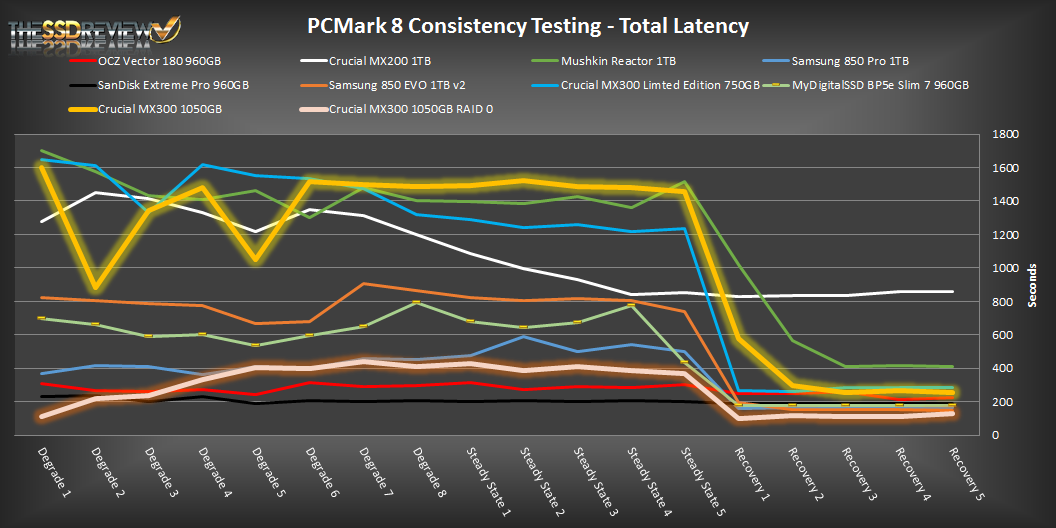
In PCMark 8’s consistency test the 1050GB MX300 showed very similar results to that of the 750GB model. Indicated by the results, the MX300 SSDs are not meant for heavy workload environments, but instead typical client/desktop usage. Over the degrade and steady state workload phases it was one of the worse performing SSDs, however, during the recovery phases, performance was much more acceptable. It averaged 0.94ms latency and had an average bandwidth of 175MB/s. While this is an improvement over the 1TB MX200 it succeeds, compared to other SSDs, these results are not all that impressive. Moving onto the RAID 0 results, they are much better. Average latency during the steady state phases was drastically reduced and performed best in the recovery section beating out all the other options. Interestingly and unlike our other results, the bandwidth performance didn’t quite double here. Overall though, we can see a notable improvement moving to a RAID 0 from a single SSD setup in this test. Let’s move on to our real world file transfer and power testing results on the next page to see how well it does there.
1TB prices still too high
Thanks for the review with the HD Tune 🙂
It´s essiential for me to see how fast a SSD is if the SLC-cache is full
I wonder if Crucial SE still can’t update SSD firmware if boot drive is an NVMe device. I reported this problem ages ago, curious if they fixed this annoyance.
Performance-wise. I would still pick 850EVO. If anyone wants blazing speed for data then get any supported SSD, activate RAPID mode (careful, not advisable on boot drive) and enjoy. I have one activated on 1TB model with R/W at 7500MB/s and NVMe is nowhere (owning couple of i750s).
Would you benchmark also the smallest model? I can’t find any benchmarks of MX300 275GB on the net, and I’m curious how much performance it sacrifices due to reduced die count.
Here
https://www.realhardwarereviews.com/crucial-mx300-275gb-quad-raid-0/
Shorely this is not the scent of some Kibutzim Kowboy on Da Yeehaw? You know, where the ability to Fool The Fool-ables is not as Easy as any PC.
That which is true, is true for ALL. Unlike “Les Da Tokar”, we all have 2 Eyes, 2 Ears, etc.. So Guyz N Galz, “review” like with like or else comparing Apples to Oranges is meaningless to either Apples or Oranges when comparing. Unless, Da Stupide-Dumbe are all-a-congregating over here at Da SSD Review Festivaal. Next, “they” be saying that Pillaging & Plundering is AOK beecuz some Booke sez, “Eets OK, Munn !”
C’mon, shorely The Stupid-Dumb are dying-off as quickly as Pillaging & Plundering are flourishing beecuz Da Kibuttzim Kowboys are now nuclear-tipped armed. Why do it, even when you can? Unless ……. like “Les”, yore Eyes are like Da Cyclops.
FYI I picked up 2x 750GB on sale and run in Raid 0. 33% more capacity than the 1TB version for the same price and WAY faster in Raid 0 than 1x1TB, I am pretty pleased, keep an eye out for that option.