
The SSD Review uses benchmark software called PCMark Vantage x64 HDD Suite to create testing scenarios that might be used in the typical user experience. There are eight tests in all and the tests performed record the speed of data movement in MB/s to which they are then given a numerical score after all of the tests are complete. The simulations are as follows:
- Windows Defender In Use
- Streaming Data from storage in games such as Alan Wake which allows for massive worlds and riveting non-stop action
- Importing digital photos into Windows Photo Gallery
- Starting the Vista Operating System
- Home Video editing with Movie Maker which can be very time consuming
- Media Center which can handle video recording, time shifting and streaming from Windows media center to an extender such as Xbox
- Cataloging a music library
- Starting applications
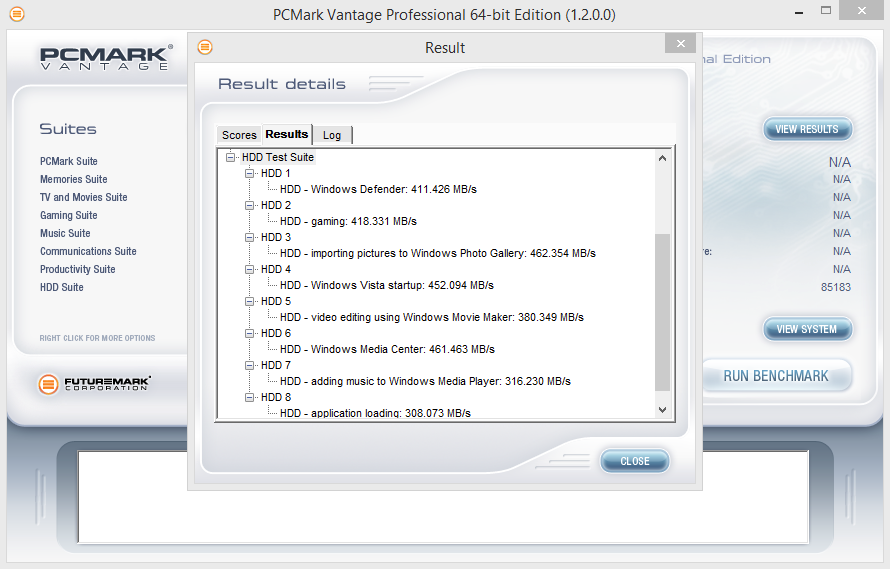
PCMARK VANTAGE RESULTS
In PCMark Vantage, both capacities performed very well. The Crucial BX100 500GB (results pictured left) achieved a Total Score of 86,138 points with a high transfer speed of 469MB/s during the Windows Media Center phase. The Crucial BX100 1TB achieved a Total Score of 85,183 points with a high transfer speed of 461MB/s during the Windows Media Center phase. The application loading benchmark results was the lowest with both SSDs reaching 309MB/s and 308MB/s respectively.

For our last benchmark, we have decided to use PCMark 8 Extended Storage Workload in order to determine steady state throughput of the SSD. This software is the longest in our battery of tests and takes just under 18 hours per SSD. As this is a specialized component of PCMark 8 Professional, its final result is void of any colorful graphs or charts typical of the normal online results and deciphering the resulting excel file into an easily understood result takes several more hours.
There are 18 phases of testing throughout the entire run, 8 runs of the Degradation Phase, 5 runs of the Steady State Phase and 5 runs of the Recovery Phase. In each phase, several performance tests are run of 10 different software programs; Adobe After Effects, Illustrator, InDesign, Photoshop Heavy and Photoshop Light, Microsoft Excel, PowerPoint and Word, as well as Battlefield 3 and World of Warcraft to cover the gaming element.
- PRECONDITIONING -The entire SSD is filled twice sequentially with random data of a 128KB file size. The second run accounts for overprovisioning that would have escaped the first;
- DEGRADATION PHASE – The SSD is hit with random writes of between 4KB and 1MB for 10 minutes and then a single pass performance test is done of each application. The cycle is repeated 8 times, and with each time, the duration of random writes increases by 5 minutes;
- STEADY STATE PHASE – The drive is hit with random writes of between 4KB and 1MB for 45 minutes before each application is put through a performance test. This process is repeated 5 times;
- RECOVERY PHASE – The SSD is allowed to idle for 5 minutes before and between performance tests of all applications. This is repeated 5 times which accounts for garbage collection; and
- CLEANUP – The entire SSD is written with zero data at a write size of 128KB
In reading the results, the Degrade and Steady State phases represent heavy workload testing while the recovery phase represents typical consumer light workload testing.
As you can see, performance is recorded in terms of Bandwidth and Latency. Bandwidth (or throughput) represents the total throughput the drive is able to sustain during the tests during each phase. Latency, at least for the purposes of PCMark 8, takes on a different outlook and for this, we will term it ‘Total Storage Latency’. Typically, latency has been addressed as the time it takes for a command to be executed, or rather, the time from when the last command completed to the time that the next command started. This is shown below as ‘Average Latency’.
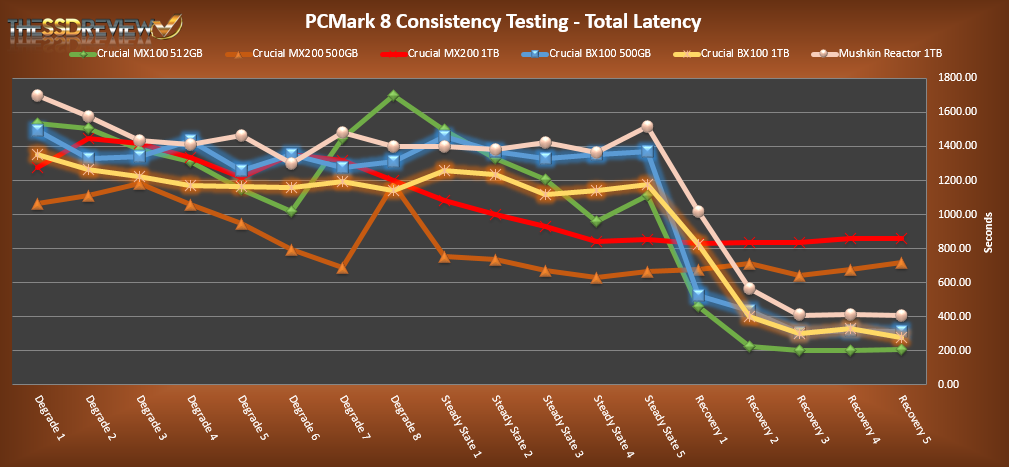
PCMark 8 provides a slightly different measurement, however, that we are terming as ‘Total Storage Latency’. This is represented as being the period from the time the last command was completed, until the time it took to complete the next task; the difference of course being that the execution of that task is included in ‘Total Storage Latency’. For both latency graphs, the same still exists where the lower the latency, the faster the responsiveness of the system will be. While both latency charts look very similar, the scale puts into perspective how just a few milliseconds can increase the length of time to complete multiple workloads.
For a more in-depth look into Latency, Bandwidth, and IOPS check out our primer article on them here.
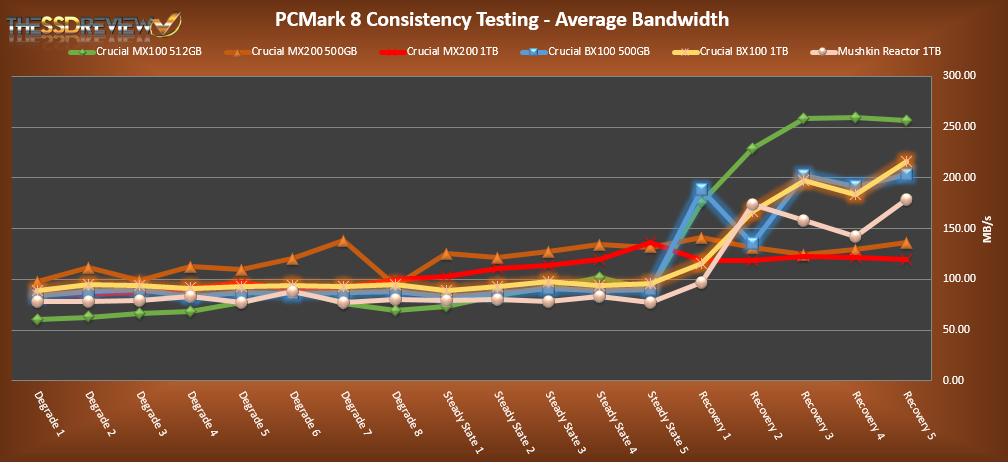
AVERAGE BANDWIDTH (OR THROUGHPUT)
These results show the total average bandwidth across all tests in the 18 phases. In this graph the higher the result the better.
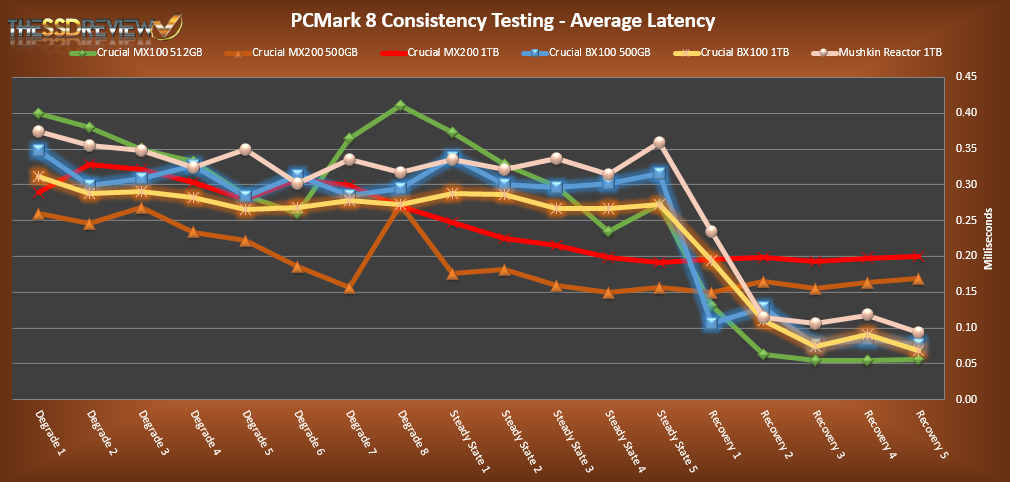
AVERAGE LATENCY (OR ACCESS TIME)
These results show the average access time during the workloads across all tests in the 18 phases. In this graph the lower the result the better.
TOTAL STORAGE LATENCY
These results show the total access time across all tests in the 18 phases. In this graph the lower the result the better.
In both PCMark 8 bandwidth and latency tests, the BX100 does reasonably well against its brothers. Both of the capacities do better on average than all the other SSDs except for the MX100. The BX100 SSDs have better consistency under heavy workloads than the MX100 and better performance under light workloads than the new MX200. We can also see that Crucial has tweaked the firmware of the Silicon Motion controller to provide better performance than that of the Mushkin Reactor.
Hha, it’s as if every company is trying SM2246. Factoring reliability and number of appearances, SM2246 might end-up the most popular controller ever.
They will need quite some time to catch up with sandforce sf2xxx though.
That thing was literaly everywhere and used by everyone.
As long as it’s not as UNRELIABLE as Sandforce 2X…………
Thats a pretty insane value. Cant wait for 1TB version to drop in price even further (a sub 200€ would be awsome someday 😀 :D).
This is a great SSD at an insanely low price backed by Micron quality (as opposed to PNY). I don’t know if they make money on it but I will take it!
is it worth buying bx100 500gb for $95 brand new? I’m offered by one of the shop sales person for special price.
For that kind of price, i would buy truckload of them 🙂
A very nice product from Crucial. But when compared with MX100 , which is the best ?
https://www.techwarn.com/crucial-bx100-vs-mx100-review/
We can do this price
I know this page is five years old, but how can the write endurance be 72 terabytes for both the 120 gig and the 1 terabyte version? That makes zero sense. I feel this comment is relevant, because as these drives age, the write endurance become more and more relevant.