
The SSD Review uses benchmark software called PCMark Vantage x64 HDD Suite to create testing scenarios that might be used in the typical user experience. There are eight tests in all and the tests performed record the speed of data movement in MB/s to which they are then given a numerical score after all of the tests are complete. The simulations are as follows:
- Windows Defender In Use
- Streaming Data from storage in games such as Alan Wake which allows for massive worlds and riveting non-stop action
- Importing digital photos into Windows Photo Gallery
- Starting the Vista Operating System
- Home Video editing with Movie Maker which can be very time consuming
- Media Center which can handle video recording, time shifting and streaming from Windows media center to an extender such as Xbox
- Cataloging a music library
- Starting applications
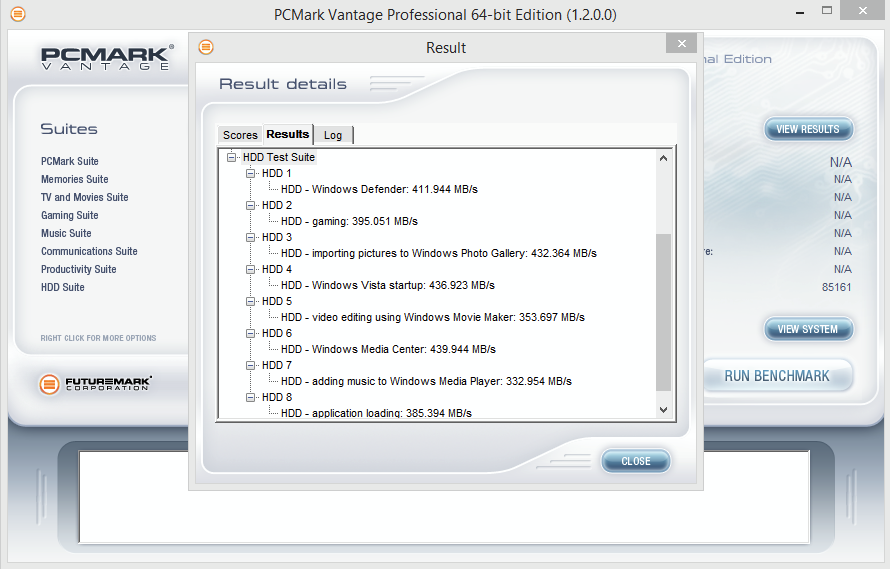
PCMARK VANTAGE RESULTS
Now we finally get to take a look at simulated real world performance. Not surprisingly the 120GB model takes a slight lead due to faster 4K read speeds, however, all models have very similar scores ranging from 83K – 85K. This performance is very good and in line with most other mainstream SSDs. Let’s move on and see how it compares in our PCMark 8 torture testing.
120GB
 240GB
240GB 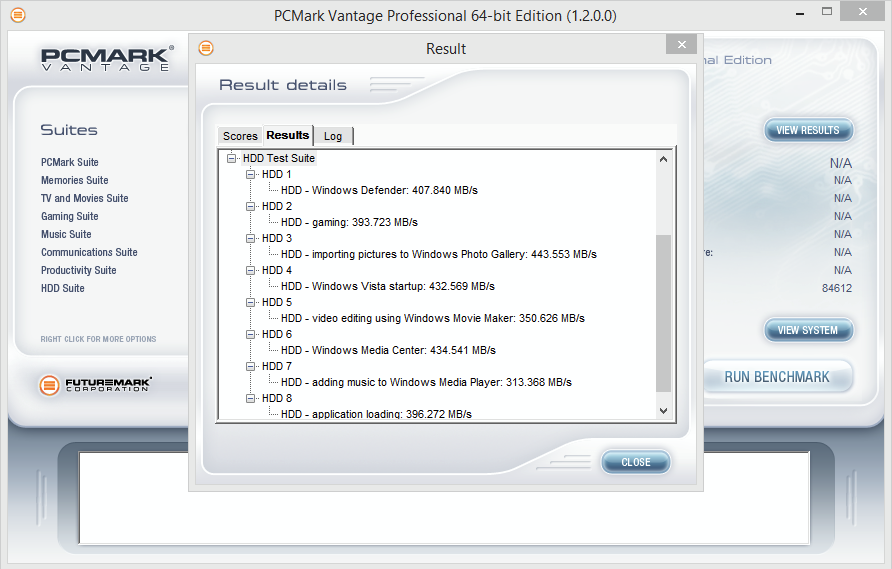 480GB
480GB 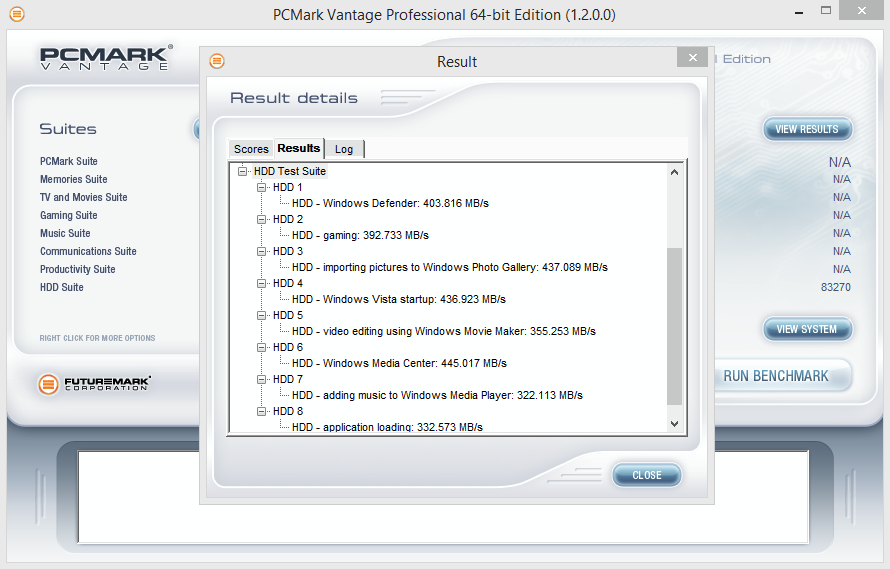
For our last benchmark, we have decided to use PCMark 8 Extended Storage Workload in order to determine steady state throughput of the SSD. This software is the longest in our battery of tests and takes just under 18 hours per SSD. As this is a specialized component of PCMark 8 Professional, its final result is void of any colorful graphs or charts typical of the normal online results and deciphering the resulting excel file into an easily understood result takes several more hours.
There are 18 phases of testing throughout the entire run, 8 runs of the Degradation Phase, 5 runs of the Steady State Phase and 5 runs of the Recovery Phase. In each phase, several performance tests are run of 10 different software programs; Adobe After Effects, Illustrator, InDesign, Photoshop Heavy and Photoshop Light, Microsoft Excel, PowerPoint and Word, as well as Battlefield 3 and World of Warcraft to cover the gaming element.
- PRECONDITIONING -The entire SSD is filled twice sequentially with random data of a 128KB file size. The second run accounts for overprovisioning that would have escaped the first;
- DEGRADATION PHASE – The SSD is hit with random writes of between 4KB and 1MB for 10 minutes and then a single pass performance test is done of each application. The cycle is repeated 8 times, and with each time, the duration of random writes increases by 5 minutes;
- STEADY STATE PHASE – The drive is hit with random writes of between 4KB and 1MB for 45 minutes before each application is put through a performance test. This process is repeated 5 times;
- RECOVERY PHASE – The SSD is allowed to idle for 5 minutes before and between performance tests of all applications. This is repeated 5 times which accounts for garbage collection; and
- CLEANUP – The entire SSD is written with zero data at a write size of 128KB
In reading the results, the Degrade and Steady State phases represent heavy workload testing while the recovery phase represents typical consumer light workload testing.
As you can see, performance is recorded in terms of Bandwidth and Latency. Bandwidth (or throughput) represents the total throughput the drive is able to sustain during the tests during each phase. Latency, at least for the purposes of PCMark 8, takes on a different outlook and for this, we will term it ‘Total Storage Latency’. Typically, latency has been addressed as the time it takes for a command to be executed, or rather, the time from when the last command completed to the time that the next command started. This is shown below as ‘Average Latency’.
PCMark 8 provides a slightly different measurement, however, that we are terming as ‘Total Storage Latency’. This is represented as being the period from the time the last command was completed, until the time it took to complete the next task; the difference of course being that the execution of that task is included in ‘Total Storage Latency’. For both latency graphs, the same still exists where the lower the latency, the faster the responsiveness of the system will be. While both latency charts look very similar, the scale puts into perspective how just a few milliseconds can increase the length of time to complete multiple workloads.
For a more in-depth look into Latency, Bandwidth, and IOPS check out our primer article on them here.
AVERAGE BANDWIDTH (OR THROUGHPUT)
These results show the total average bandwidth across all tests in the 18 phases. In this graph the higher the result the better.

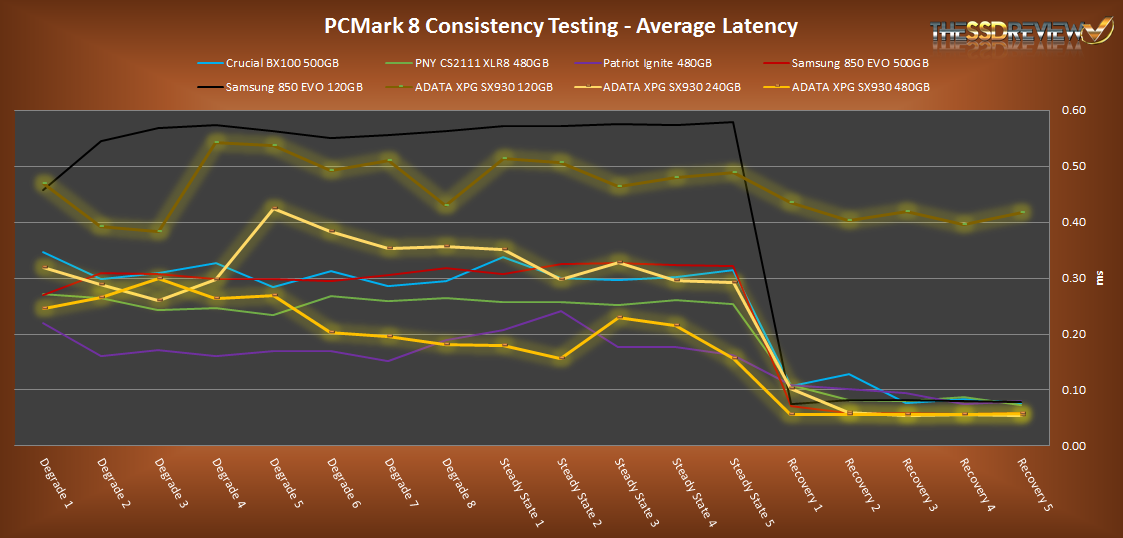
AVERAGE LATENCY (OR ACCESS TIME)
These results show the average access time during the workloads across all tests in the 18 phases. In this graph the lower the result the better.
TOTAL STORAGE LATENCY
These results show the total access time across all tests in the 18 phases. In this graph the lower the result the better.

Looking at the performance, the 240GB and 480GB models are very competitive in the degraded and steady state workloads, though overall, inconsistent. Once in the recovery stages, however, performance is just about on par with the Samsung 850 EVO! The 120GB model doesn’t seem to recover like the larger capacities however. Its performance is similar to what we seen with the Micron MX200 back in February. Based on these results, we will say that you are better off going with the two larger capacities over the 120GB when possible.
I would like to buy an SSD for the operating system.
I am thinking over this one
https://hardware.nl/adata/asp600s3-64gm-c.html
But maybe it is better yo purchase more storage? Here is another one
https://www.amazon.com/ADATA-SX900-SandForce-Synchronous-ASX900S3-256GM-C/dp/B007M7XS94
Windows 7 demands 20 GB of space. So 64GB SSD should be enough, but I am not sure.
While Windows can take around 20-30GB I would still suggest purchasing at least a 120GB drive due to programs and personal files taking more space. Right now, however, it makes more sense to buy a 256GB model because of the price to capacity value.
I have a 256Gb Pro Samsung SSD and it’s okay for now. In the beginning I got 500+ Mb/s but it’s down to 200/300 Mb/s and the i/o speed has dropped a hundred points in the first 6 months. It’s not as fast as it was and it’s barely going on a year old.
This is for me what would you suggest hold data and transfer when needed to a sata drive some thing that has good read write capabilities can withstand a bit of punishment
i copy customers data and get rid of viruses etc from said drives and got customers pc coming in whos ssds is full of viruses etc so i have set up new one and get the data of the old one a lot of work ps thankyou for any help you can give me