
The SSD Review uses PCMark 8’s Storage test suite to create testing scenarios that might be used in the typical user experience. With 10 traces recorded from Adobe Creative Suite, Microsoft Office and a selection of popular games, it covers some of the most popular light to heavy workloads. Unlike synthetic storage tests, the PCMark 8 Storage benchmark highlights real-world performance differences between storage devices. After an initial break-in cycle and three rounds of the testing, we are given a file score and bandwidth amount. The higher the score/bandwidth, the better the drive performs.
PCMARK 8 STORAGE RESULTS

In PCMark 8 the Intel 600P scored 5068 points and averaged 333.62MB/s in bandwidth.
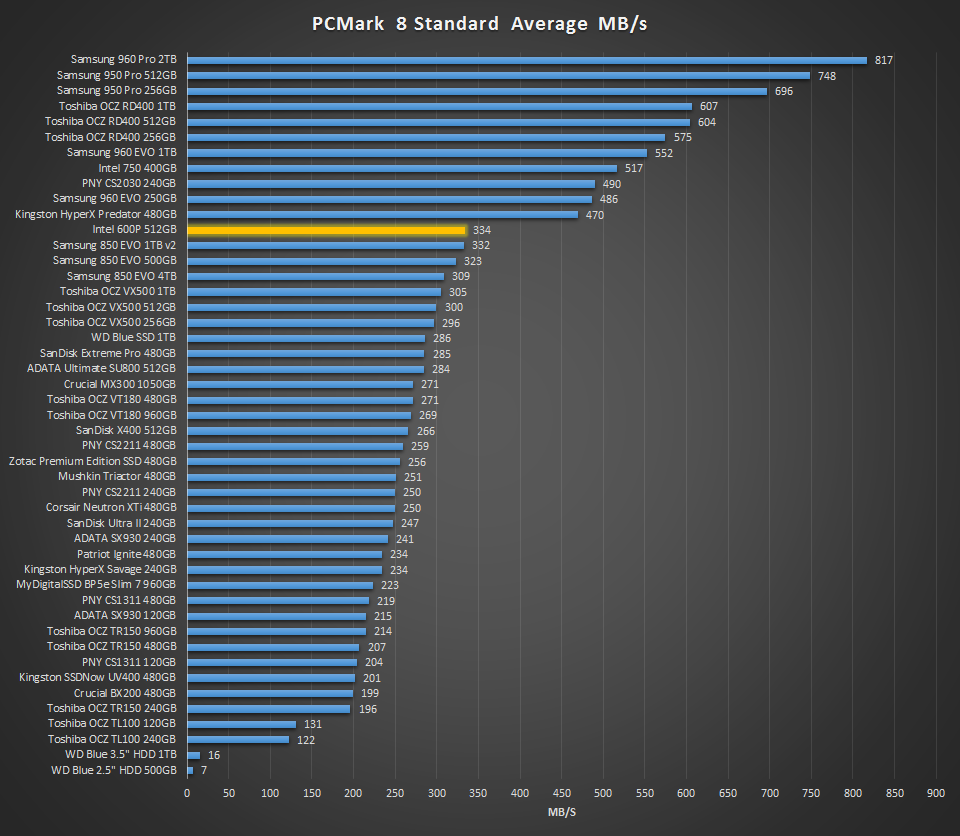
This score places it just above every SATA SSD and just under every PCIe SSD on our comparison list. The 600P just barely beats out the Samsung 850 EVO and this result solidifies the 600Ps market ranking. The Kingston HyperX Predator’s 1GB/s write performance seems to give it quite the advantage over the Intel 600P in this test even though its read performance is capped off lower at a lower result of 1.4GB/s.
PCMARK 8 EXTENDED STORAGE WORKLOAD CONSISTENCY TESTING
For our last benchmark, we have decided to use PCMark 8 Extended Storage Workload in order to determine steady state throughput of the SSD. This software is the longest in our battery of tests and takes just under 18 hours per SSD. As this is a specialized component of PCMark 8 Professional, its final result is void of any colorful graphs or charts typical of the normal online results and deciphering the resulting excel file into an easily understood result takes several more hours.
There are 18 phases of testing throughout the entire run, 8 runs of the Degradation Phase, 5 runs of the Steady State Phase and 5 runs of the Recovery Phase. In each phase, several performance tests are run of 10 different software programs; Adobe After Effects, Illustrator, InDesign, Photoshop Heavy and Photoshop Light, Microsoft Excel, PowerPoint and Word, as well as Battlefield 3 and World of Warcraft to cover the gaming element.
- PRECONDITIONING -The entire SSD is filled twice sequentially with random data of a 128KB file size. The second run accounts for overprovisioning that would have escaped the first;
- DEGRADATION PHASE – The SSD is hit with random writes of between 4KB and 1MB for 10 minutes and then a single pass performance test is done of each application. The cycle is repeated 8 times, and with each time, the duration of random writes increases by 5 minutes;
- STEADY STATE PHASE – The drive is hit with random writes of between 4KB and 1MB for 45 minutes before each application is put through a performance test. This process is repeated 5 times;
- RECOVERY PHASE – The SSD is allowed to idle for 5 minutes before and between performance tests of all applications. This is repeated 5 times which accounts for garbage collection; and
- CLEANUP – The entire SSD is written with zero data at a write size of 128KB
In reading the results, the Degrade and Steady State phases represent heavy workload testing while the recovery phase represents typical consumer light workload testing.
As you can see, performance is recorded in terms of Bandwidth and Latency. Bandwidth (or throughput) represents the total throughput the drive is able to sustain during the tests during each phase. Latency, at least for the purposes of PCMark 8, takes on a different outlook and for this, we will term it ‘Total Storage Latency’. Typically, latency has been addressed as the time it takes for a command to be executed, or rather, the time from when the last command completed to the time that the next command started. This is shown below as ‘Average Latency’.
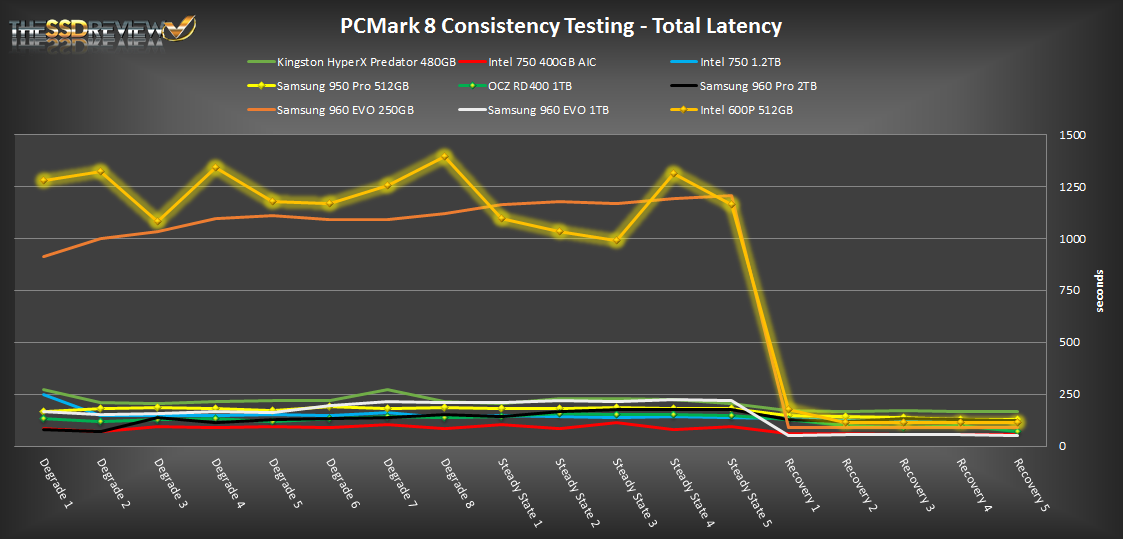
PCMark 8 provides a slightly different measurement, however, that we are terming as ‘Total Storage Latency’. This is represented as being the period from the time the last command was completed, until the time it took to complete the next task; the difference of course being that the execution of that task is included in ‘Total Storage Latency’. For both latency graphs, the same still exists where the lower the latency, the faster the responsiveness of the system will be. While both latency charts look very similar, the scale puts into perspective how just a few milliseconds can increase the length of time to complete multiple workloads.
For a more in-depth look into Latency, Bandwidth, and IOPS check out our primer article on them here.
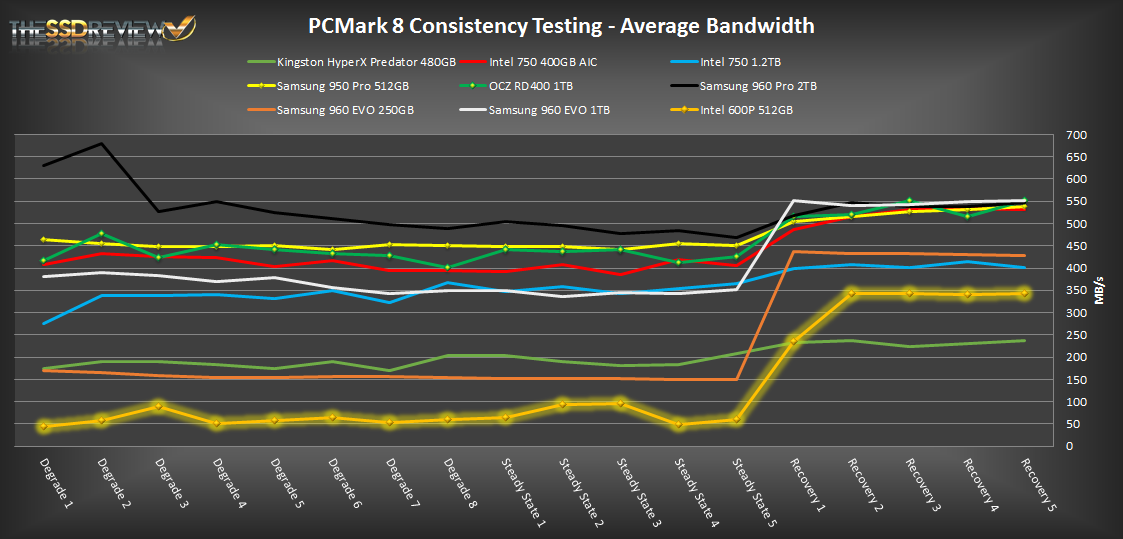
AVERAGE BANDWIDTH (OR THROUGHPUT)
These results show the total average bandwidth across all tests in the 18 phases. In this graph the higher the result the better.
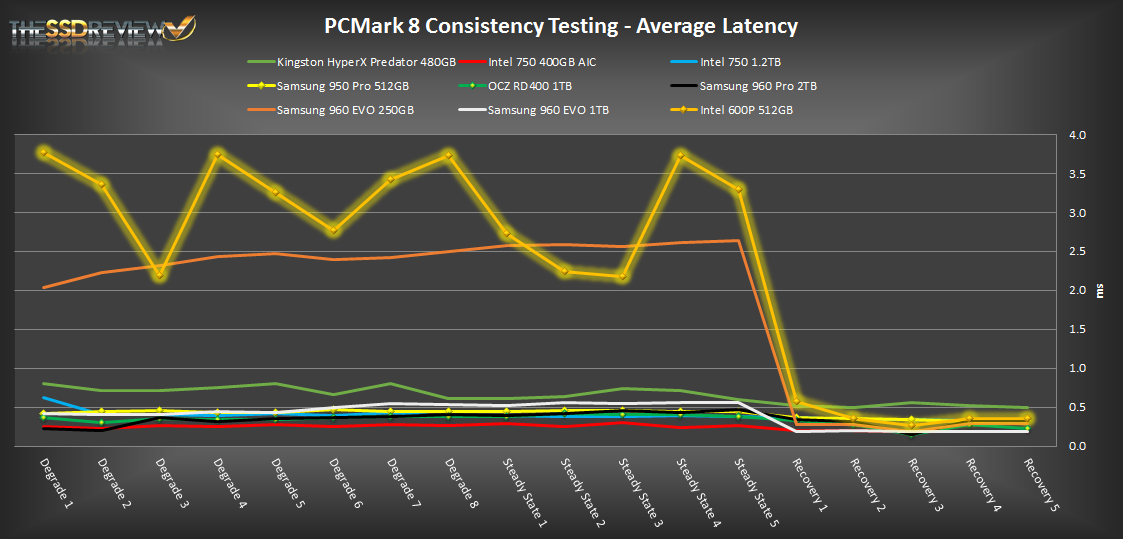
AVERAGE LATENCY (OR ACCESS TIME)
These results show the average access time during the workloads across all tests in the 18 phases. In this graph the lower the result the better.
TOTAL STORAGE LATENCY
These results show the total access time across all tests in the 18 phases. In this graph the lower the result the better.
After many grueling rounds of testing in PCMark 8’s consistency test, we can see that its performance profile is similar in shape to that of the 250GB Samsung 960 EVO. During the heavy workloads (degrade and steady state rounds) the Intel 600P’s performance is far behind its PCIe bothers. Once the recovery stages come in, however, the Intel 600P is on par with the competition. Therefore, we wouldn’t recommend this drive to anyone who wants to use it for heavy media creation or write workloads. In most everyday, normal desktop/laptop use cases, however, PCMark8’s normal storage suite and the extended recovery results prove it is a good buy performance wise.
Passed my first test-At least 8K-IOPS-QD1.
Failed my second-Must write 200+ after buffer
can’t have it bottleneck my spinning rust.
Write speed shocked me for a 500 size drive
those speeds you expect on a 120 size drive.
And why the SLC cache so small???????
The ATTO results make sense as the 600p doesn’t have a controller that supports direct to die algorithm to relieve the bottle neck that occurs once the SLC cache is full. That being said very few program reads, go above 128K in windows. So, everything past that is just large file transfer, and really inconsequential in day to day compute performance outside of OS install.