
The SSD Review uses PCMark 8’s Storage test suite to create testing scenarios that might be used in the typical user experience. With 10 traces recorded from Adobe Creative Suite, Microsoft Office and a selection of popular games, it covers some of the most popular light to heavy workloads. Unlike synthetic storage tests, the PCMark 8 Storage benchmark highlights real-world performance differences between storage devices. After an initial break-in cycle and three rounds of the testing, we are given a file score and bandwidth amount. The higher the score/bandwidth, the better the drive performs.
PCMARK 8 STORAGE RESULTS
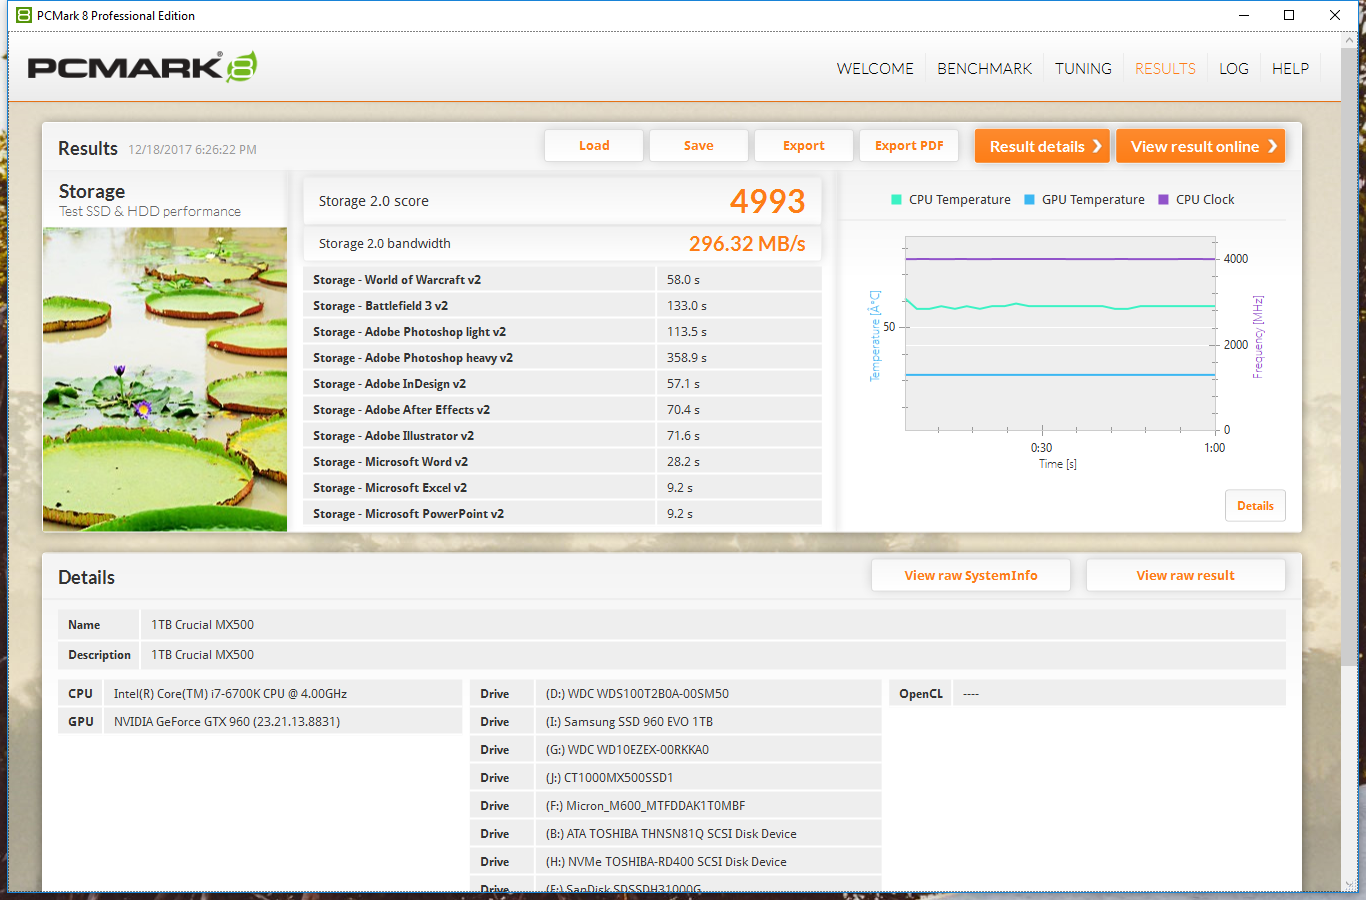
In PCMark 8 the Crucial MX500 4993 points and averaged 296MB/s in bandwidth.
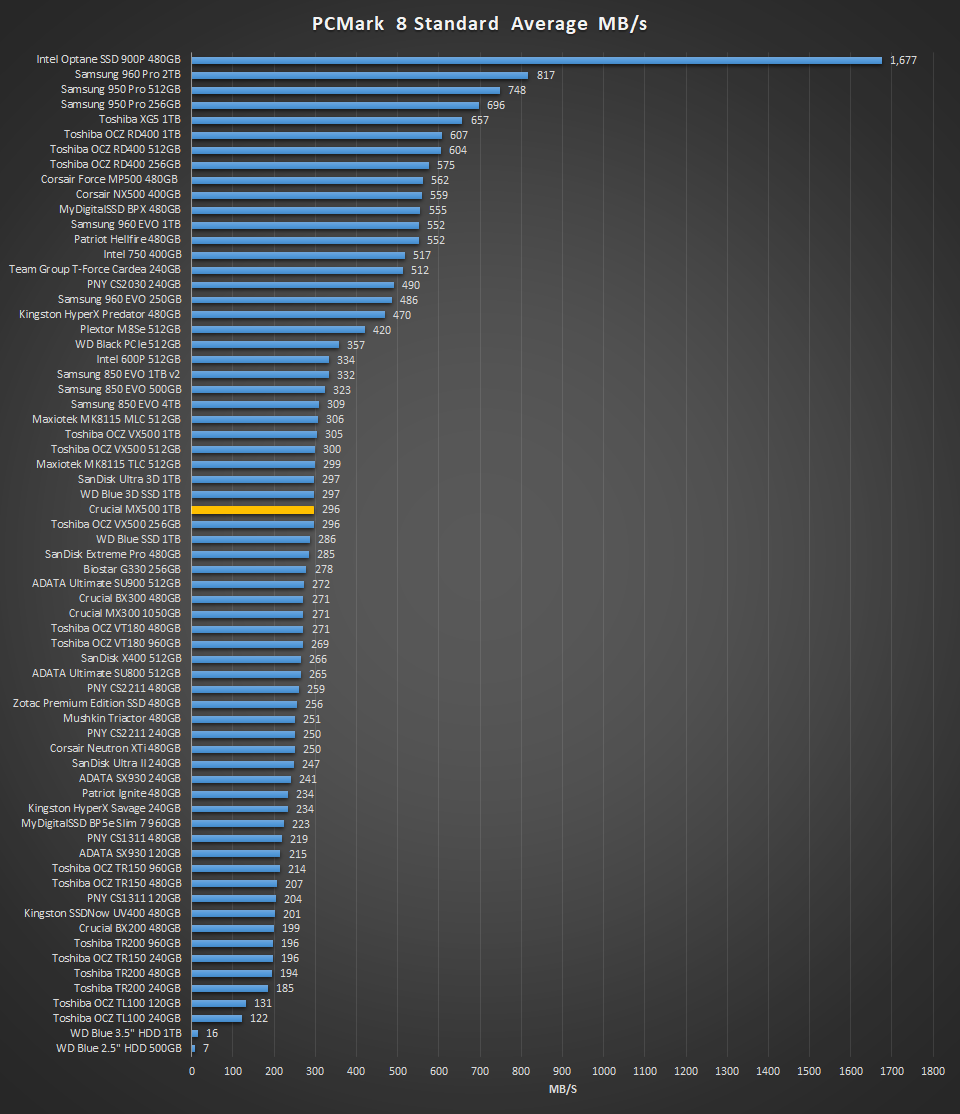
With its average bandwidth of 296MB/s, the MX500 ranks similar to the WD Blue 3D SSD and SanDisk Ultra 3D SSD. This also ranks it above its predecessor, the MX300 and less featureful brother, the BX300. Compared to the Samsung 850 EVO, however, it still needs a little more oomph to keep up.
PCMARK 8 EXTENDED STORAGE WORKLOAD CONSISTENCY TESTING
For our last benchmark, we have decided to use PCMark 8 Extended Storage Workload in order to determine steady-state throughput of the SSD. This software is the longest in our battery of tests and takes just under 18 hours per SSD. As this is a specialized component of PCMark 8 Professional, its final result is void of any colorful graphs or charts typical of the normal online results and deciphering the resulting excel file into an easily understood result takes several more hours.
There are 18 phases of testing throughout the entire run, 8 runs of the Degradation Phase, 5 runs of the Steady State Phase and 5 runs of the Recovery Phase. In each phase, several performance tests are run of 10 different software programs; Adobe After Effects, Illustrator, InDesign, Photoshop Heavy and Photoshop Light, Microsoft Excel, PowerPoint and Word, as well as Battlefield 3 and World of Warcraft to cover the gaming element.
- PRECONDITIONING -The entire SSD is filled twice sequentially with random data of a 128KB file size. The second run accounts for overprovisioning that would have escaped the first;
- DEGRADATION PHASE – The SSD is hit with random writes of between 4KB and 1MB for 10 minutes and then a single pass performance test is done of each application. The cycle is repeated 8 times, and with each time, the duration of random writes increases by 5 minutes;
- STEADY STATE PHASE – The drive is hit with random writes of between 4KB and 1MB for 45 minutes before each application is put through a performance test. This process is repeated 5 times;
- RECOVERY PHASE – The SSD is allowed to idle for 5 minutes before and between performance tests of all applications. This is repeated 5 times which accounts for garbage collection; and
- CLEANUP – The entire SSD is written with zero data at a write size of 128KB
In reading the results, the Degrade and Steady State phases represent heavy workload testing while the recovery phase represents typical consumer light workload testing.
As you can see, performance is recorded in terms of Bandwidth and Latency. Bandwidth (or throughput) represents the total throughput the drive is able to sustain during the tests during each phase. Latency, at least for the purposes of PCMark 8, takes on a different outlook and for this, we will term it ‘Total Storage Latency’. Typically, latency has been addressed as the time it takes for a command to be executed, or rather, the time from when the last command completed to the time that the next command started. This is shown below as ‘Average Latency’.
PCMark 8 provides a slightly different measurement, however, that we are terming as ‘Total Storage Latency’. This is represented as being the period from the time the last command was completed until the time it took to complete the next task; the difference, of course, is that the execution of that task is included in ‘Total Storage Latency’. For both latency graphs, the same still exists where the lower the latency, the faster the responsiveness of the system will be. While both latency charts look very similar, the scale puts into perspective how just a few milliseconds can increase the length of time to complete multiple workloads.
For a more in-depth look at Latency, Bandwidth, and IOPS check out our primer article on them here.
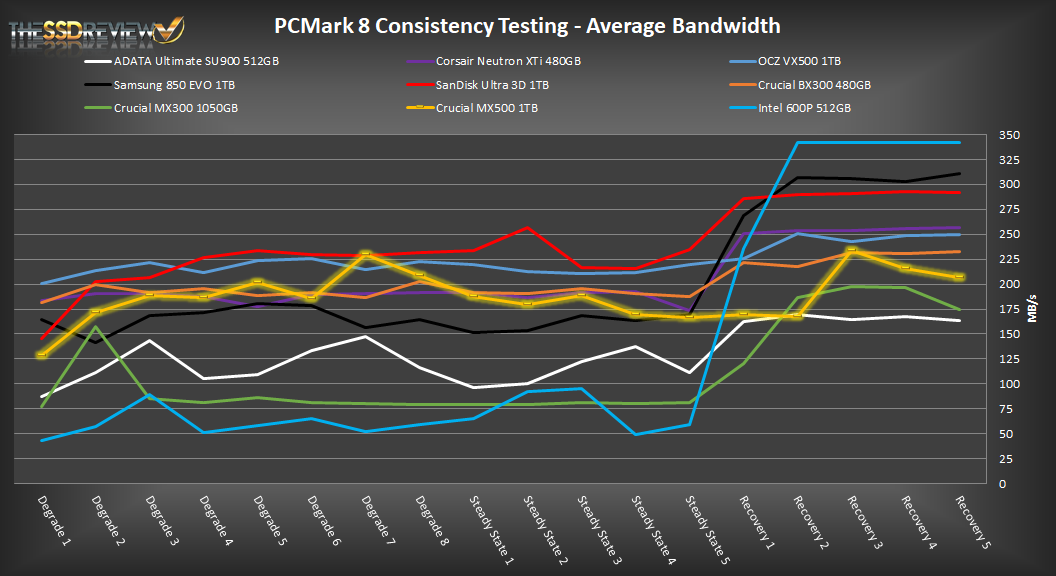
AVERAGE BANDWIDTH (OR THROUGHPUT)
These results show the total average bandwidth across all tests in the 18 phases. In this graph the higher the result the better.
AVERAGE LATENCY (OR ACCESS TIME)
These results show the average access time during the workloads across all tests in the 18 phases. In this graph the lower the result the better.
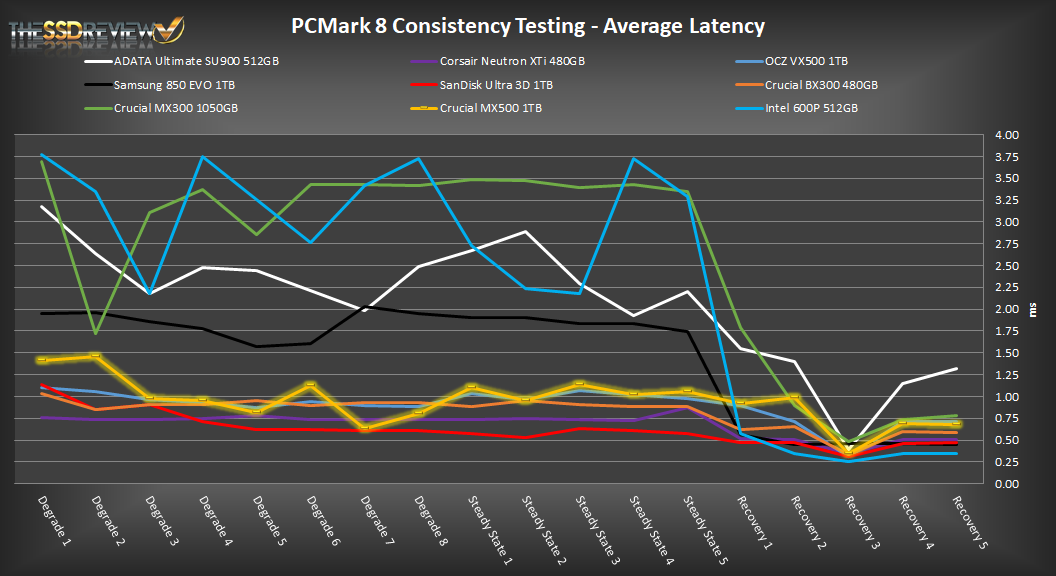
The MX500’s performance here is much improved over its predecessor. During the degrade and steady state phases the Crucial MX500’s latency averages out to about 1ms, that is 30% of the MX300’s under the same test! Quite an improvement. On top of that, we can see that bandwidth has increased a lot as well, going from the MX300’s result of about 75MB/s all the way up to 175MB/s to 200MB/s at one point! While this is a nice improvement, we look at the competition and can see that Crucial still has some work to do to improve performance more. The age-old Samsung 850 EVO is still top dog in SATA here and the SanDisk Ultra 3D and WD Blue 3D SSDs both give it a run for its money.
Now I care more about what languages and that meaning.
Exactly
No F1 and F2-parameter? That´s disappointing