
The SSD Review uses benchmark software called PCMark Vantage x64 HDD Suite to create testing scenarios that might be used in the typical user experience. There are eight tests in all and the tests performed record the speed of data movement in MB/s to which they are then given a numerical score after all of the tests are complete. The simulations are as follows:
- Windows Defender In Use
- Streaming Data from storage in games such as Alan Wake which allows for massive worlds and riveting non-stop action
- Importing digital photos into Windows Photo Gallery
- Starting the Vista Operating System
- Home Video editing with Movie Maker which can be very time consuming
- Media Center which can handle video recording, time shifting and streaming from Windows media center to an extender such as Xbox
- Cataloging a music library
- Starting applications
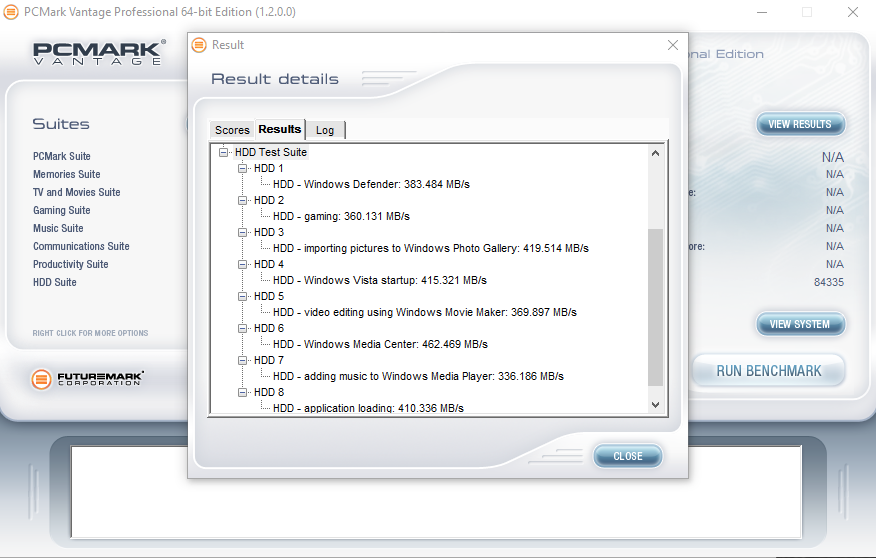
PCMARK VANTAGE RESULTS
PCMark Vantage gives us our first glimpse at real world performance. Overall, the MX300 reached 84K points, thus proving to be competitive in realistic workloads. Most benchmark speeds here exceeded 300MB/s and reached up to 462MB/s in the Windows Media Center benchmark and performance the worst in the adding music to Windows Media Player benchmark, reaching 336MB/s.
For our last benchmark, we have decided to use PCMark 8 Extended Storage Workload in order to determine steady state throughput of the SSD. This software is the longest in our battery of tests and takes just under 18 hours per SSD. As this is a specialized component of PCMark 8 Professional, its final result is void of any colorful graphs or charts typical of the normal online results and deciphering the resulting excel file into an easily understood result takes several more hours.
There are 18 phases of testing throughout the entire run, 8 runs of the Degradation Phase, 5 runs of the Steady State Phase and 5 runs of the Recovery Phase. In each phase, several performance tests are run of 10 different software programs; Adobe After Effects, Illustrator, InDesign, Photoshop Heavy and Photoshop Light, Microsoft Excel, PowerPoint and Word, as well as Battlefield 3 and World of Warcraft to cover the gaming element.
- PRECONDITIONING – The entire SSD is filled twice sequentially with random data of a 128KB file size. The second run accounts for overprovisioning that would have escaped the first;
- DEGRADATION PHASE – The SSD is hit with random writes of between 4KB and 1MB for 10 minutes and then a single pass performance test is done of each application. The cycle is repeated 8 times, and with each time, the duration of random writes increases by 5 minutes;
- STEADY STATE PHASE – The drive is hit with random writes of between 4KB and 1MB for 45 minutes before each application is put through a performance test. This process is repeated 5 times;
- RECOVERY PHASE – The SSD is allowed to idle for 5 minutes before and between performance tests of all applications. This is repeated 5 times which accounts for garbage collection; and
- CLEANUP – The entire SSD is written with zero data at a write size of 128KB
In reading the results, the Degrade and Steady State phases represent heavy workload testing while the recovery phase represents typical consumer light workload testing.
As you can see, performance is recorded in terms of Bandwidth and Latency. Bandwidth (or throughput) represents the total throughput the drive is able to sustain during the tests during each phase. Latency, at least for the purposes of PCMark 8, takes on a different outlook and for this, we will term it ‘Total Storage Latency’. Typically, latency has been addressed as the time it takes for a command to be executed, or rather, the time from when the last command completed to the time that the next command started. This is shown below as ‘Average Latency’.
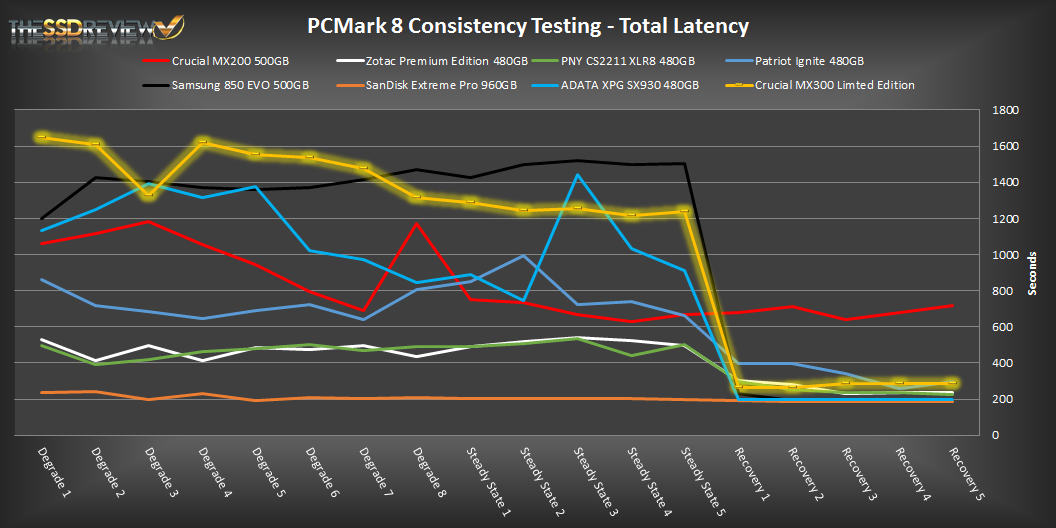
PCMark 8 provides a slightly different measurement, however, that we are terming as ‘Total Storage Latency’. This is represented as being the period from the time the last command was completed, until the time it took to complete the next task; the difference of course being that the execution of that task is included in ‘Total Storage Latency’. For both latency graphs, the same still exists where the lower the latency, the faster the responsiveness of the system will be. While both latency charts look very similar, the scale puts into perspective how just a few milliseconds can increase the length of time to complete multiple workloads.
For a more in-depth look into Latency, Bandwidth, and IOPS check out our primer article on them here.
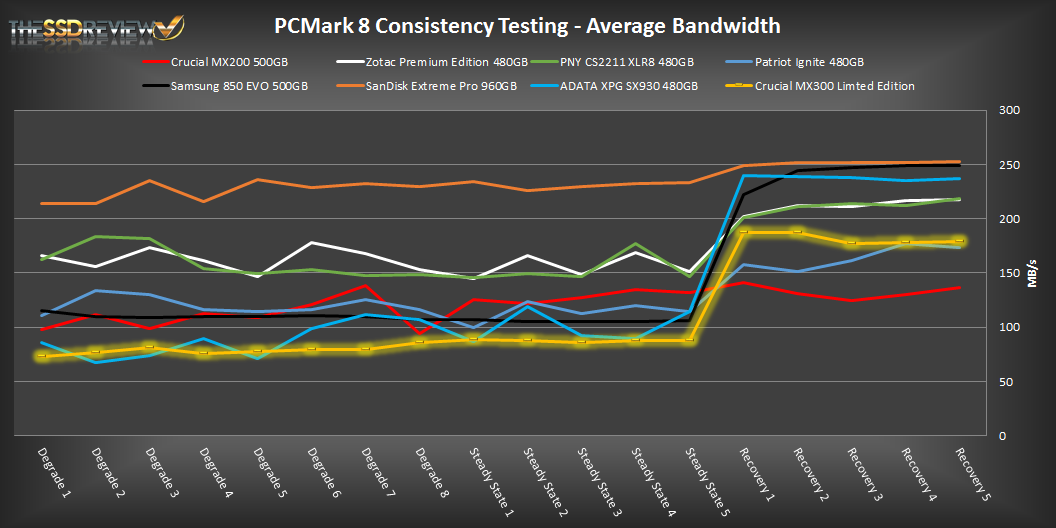
AVERAGE BANDWIDTH (OR THROUGHPUT)
These results show the total average bandwidth across all tests in the 18 phases. In this graph the higher the result the better.
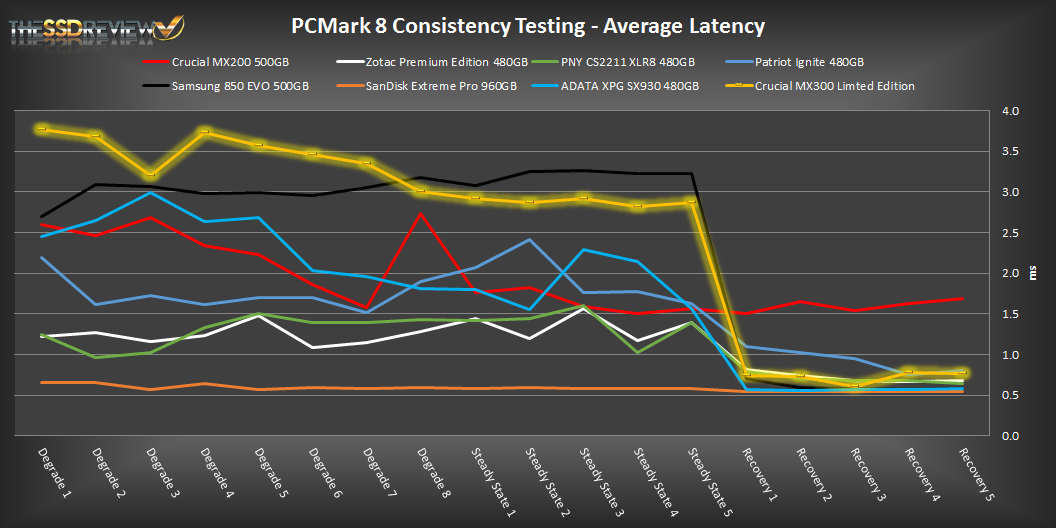
AVERAGE LATENCY (OR ACCESS TIME)
These results show the average access time during the workloads across all tests in the 18 phases. In this graph the lower the result the better.
TOTAL STORAGE LATENCY
These results show the total access time across all tests in the 18 phases. In this graph the lower the result the better.
In PCMark 8’s extended test the MX300 showed much improved performance over its MLC powered predecessor during the recovery phases. Though, during the degrade and steady state phases it did not fair too well. Average bandwidth was just over 180MB/s in the recovery phase and just over 80MB/s in the degrade and steady state phases. While latency averaged 3.24ms during the heavy workload portion, it came back down to an average of 0.72ms during the light workload potion. Compared to the test pool, we can see that it is near last throughout the run. Compared to other TLC SSDs, the MX300’s performance is good, but compared to many other enthusiast and mainstream MLC SSDs, its performance is below average.
There is a typo in the first page where you say that the mx300 has mlc nand, and some photos won’t zoom in. Otherwise good review.
Thanks for pointing that out, I fixed both issues! To be fair, TLC is technically MLC (MLC multi-level cell) NAND. Since TLC has 3-bits per cell it qualifies as MLC. It is sometimes referred to as 3-bit MLC. In the shows we’ve attended we have heard speakers refer to TLC as MLC as well due to this. It is just clearer to refer to TLC as TLC only.
Thanks for testing also the sequential write speed over the whole capacity 🙂
Sounds OK for 3D-TLC, but Samung Evo 500GB is almost 50% faster.
If the price go strong down the MX300 is maybe a good buy. But still waiting for other capacities
You’re welcome! We are patiently awaiting the other capacities as well. We are hoping to see improvements in the base write performance and when production ramps up, hopefully lower prices too! Right now $199.99 is the MSRP, so street costs should drop rather soon.
CLEVER MARKETING
750 GB means there’s no direct competitor.
This should really be the replacement for the BX200 (which deserves LEMON status)
not the MX200-That would hopefully be replaced with 3D-MLC……………..
Be interesting to see what follows-Have a feeling speeds will tank on smaller drives-Be
interesting to see this size with a 8 ch controller……….
Yeah Sean there was obviously no forward thinking when Dual bit was named MLC…
Would be nice and simple if we had-SLC-DLC-TLC.
Still a happy C400 user……………………………………………..
Seems like a great all around drive. Has good performance, good feature set, and a good price. Can you name any other drives with similar performance or better performance that have power loss protection and encryption at this price point??
The Crucial MX300 OR the MyDigitalSSD BP5e?! What would you pick Sean? Will use it for sample libraries storing…dependent on speed and reliability and ofc power efficiency, don’t want any of my SSD’s to crack. Best regards!
MX300 M.2 if you can.