
The SSD Review uses benchmark software called PCMark Vantage x64 HDD Suite to create testing scenarios that might be used in the typical user experience. There are eight tests in all and the tests performed record the speed of data movement in MB/s to which they are then given a numerical score after all of the tests are complete. The simulations are as follows:
- Windows Defender In Use
- Streaming Data from storage in games such as Alan Wake which allows for massive worlds and riveting non-stop action
- Importing digital photos into Windows Photo Gallery
- Starting the Vista Operating System
- Home Video editing with Movie Maker which can be very time consuming
- Media Center which can handle video recording, time shifting and streaming from Windows media center to an extender such as Xbox
- Cataloging a music library
- Starting applications
PCMARK VANTAGE RESULTS
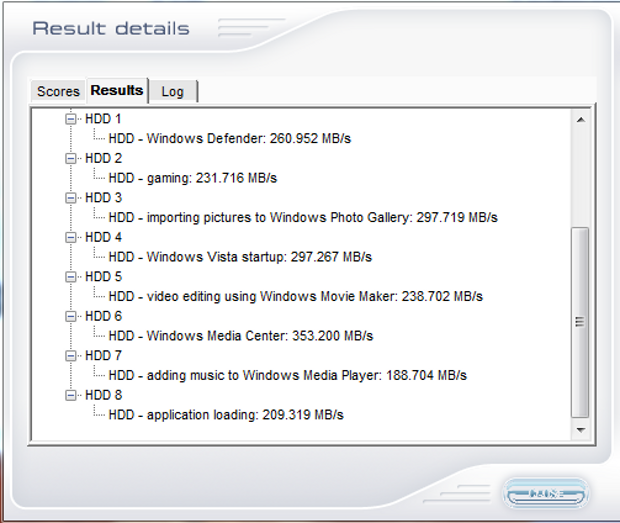 Of the eight testing scenarios, the S80 achieved its fastest transfer speeds for the Windows Media Center suite at a little over 353 MB/s.
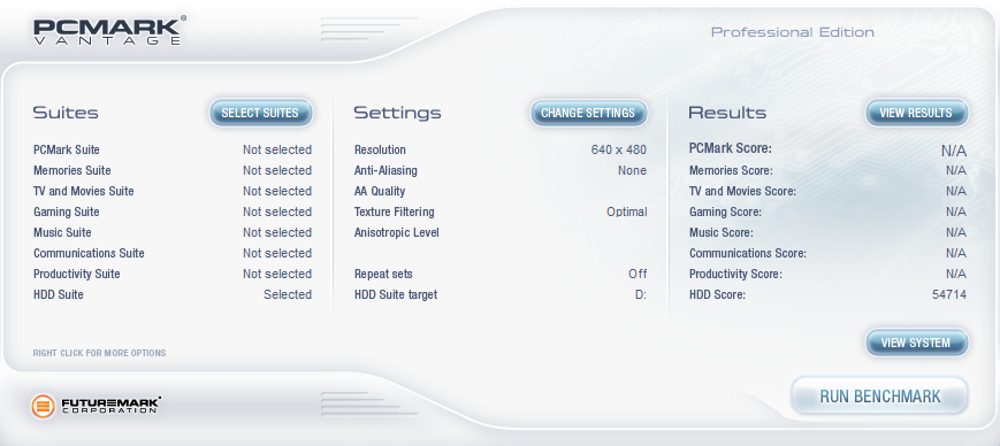
A total score of 54,714 is about average for an SSD with the Phison S8 controller. Now let’s see how the S80 stands up to a bit of extended testing.
For our last benchmark, we have decided to use PCMark 8 Extended Storage Workload in order to determine steady state throughput of the SSD. This software is the longest in our battery of tests and takes just under 18 hours per SSD. As this is a specialized component of PCMark 8 Professional, its final result is void of any colorful graphs or charts typical of the normal online results and deciphering the resulting excel file into an easily understood result takes several more hours.
There are 18 phases of testing throughout the entire run, 8 runs of the Degradation Phase, 5 runs of the Steady State Phase and 5 runs of the Recovery Phase. In each phase, several performance tests are run of 10 different software programs; Adobe After Effects, Illustrator, InDesign, Photoshop Heavy and Photoshop Light, Microsoft Excel, PowerPoint and Word, as well as Battlefield 3 and World of Warcraft to cover the gaming element.
- PRECONDITIONING -The entire SSD is filled twice sequentially with random data of a 128KB file size. The second run accounts for overprovisioning that would have escaped the first;
- DEGRADATION PHASE – The SSD is hit with random writes of between 4KB and 1MB for 10 minutes and then a single pass performance test is done of each application. The cycle is repeated 8 times, and with each time, the duration of random writes increases by 5 minutes;
- STEADY STATE PHASE – The drive is hit with random writes of between 4KB and 1MB for 45 minutes before each application is put through a performance test. This process is repeated 5 times;
- RECOVERY PHASE – The SSD is allowed to idle for 5 minutes before and between performance tests of all applications. This is repeated 5 times which accounts for garbage collection; and
- CLEANUP – The entire SSD is written with zero data at a write size of 128KB
In reading the results, the Degrade and Steady State phases represent heavy workload testing while the recovery phase represents typical consumer light workload testing.
As you can see, performance is recorded in terms of Bandwidth and Latency. Bandwidth (or throughput) represents the total throughput the drive is able to sustain during the tests during each phase. Latency, at least for the purposes of PCMark 8, takes on a different outlook and for this, we will term it ‘Total Storage Latency’. Typically, latency has been addressed as the time it takes for a command to be executed, or rather, the time from when the last command completed to the time that the next command started. This is shown below as ‘Average Latency’.
PCMark 8 provides a slightly different measurement, however, that we are terming as ‘Total Storage Latency’. This is represented as being the period from the time the last command was completed, until the time it took to complete the next task; the difference of course being that the execution of that task is included in ‘Total Storage Latency’. For both latency graphs, the same still exists where the lower the latency, the faster the responsiveness of the system will be. While both latency charts look very similar, the scale puts into perspective how just a few milliseconds can increase the length of time to complete multiple workloads.
For a more in-depth look into Latency, Bandwidth, and IOPS check out our primer article on them here.
AVERAGE BANDWIDTH (OR THROUGHPUT)
Our comparison group for this series of tests are the OCZ ARC 100 240GB, SanDisk Extreme Pro 240GB, SanDisk Ultra II 240GB, Crucial MX100 256GB and the Silicon Power S80.
These results show the total average bandwidth across all tests in the 18 phases. In this graph the higher the result the better.
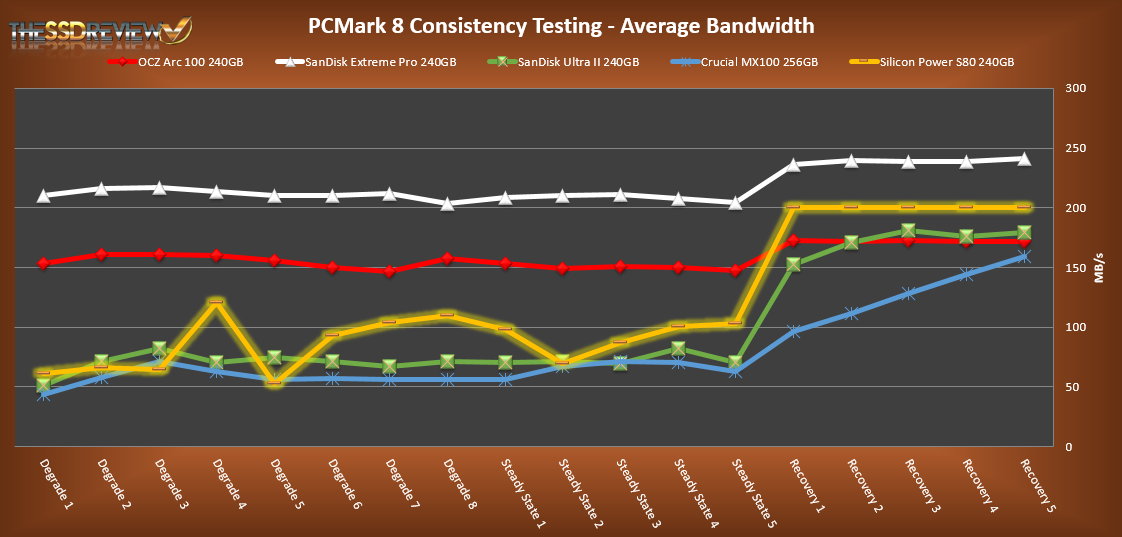
While competitive with the SanDisk Ultra II and the Micron MX100 for the “degrade” and “steady state” portions of the testing, all of these three trailed the SanDisk Extreme Pro and the OCZ Arc 100. When switching over to the “recovery” phase of the testing, the S80 bounced back ahead of all but the SanDisk Extreme Pro.
AVERAGE LATENCY (OR ACCESS TIME)
These results show the average access time during the workloads across all tests in the 18 phases. In this graph the lower the result the better.

Again in the access time testing, the S80, SanDisk Ultra II and the Micron MX100 trailed the OCZ Arc 100 and the SanDisk Extreme Pro. As with the bandwidth results, the S80 trailed only the SanDisk Extreme Pro in the recovery phase, and in this case not by much at all.
TOTAL STORAGE LATENCY
These results show the total access time across all tests in the 18 phases. In this graph the lower the result the better.
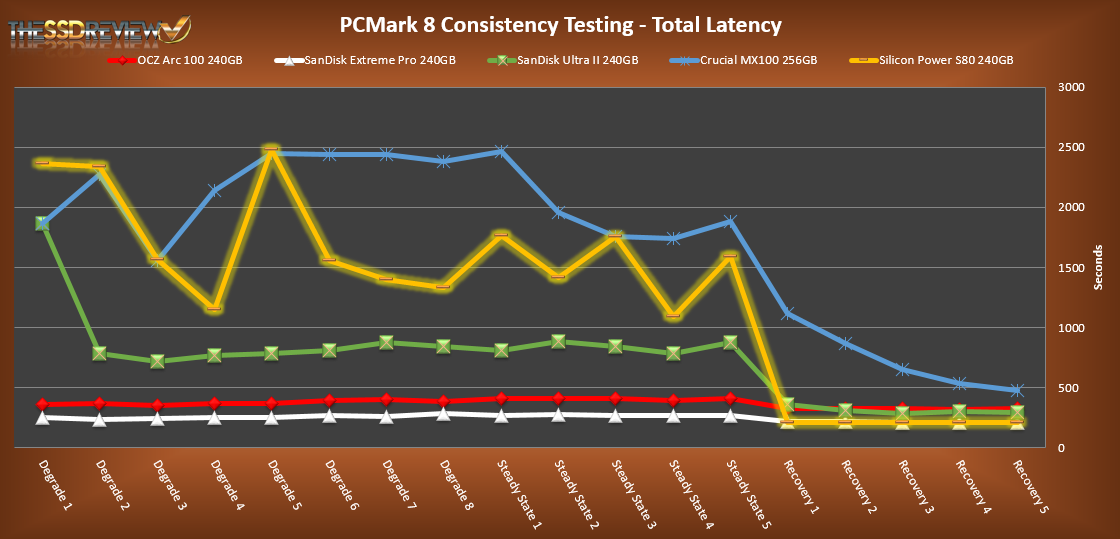
The Total Storage Latency results just about mirror the access time results. The S80 fared very well in the recovery testing, which parallels the usage of the average consumer for light workloads. With this likely being the anticipated market for the S80, it stacked up quite well against the much more premium SanDisk Extreme Pro.
240GB seems nice, but other capacity points just seem too expensive compared to the competition.
I mean, you can get reactor 1TB for 300€ nowdays.
Benjamin Hojnik you seem to know a lot about ssds. I have been reading your posts for a wile now. I have a question for you. You can respond if you like. Ive asked this question on the forums but so far no ones has answered it. Maybe you know? How does a good amount of mushkin ssds have 2,000,000 hours MTBF when they use asynchronous, synchronous and toggle flash? But other manufacturers have 1,500,000 1,200,000 1,000,000 MTBF. Whats there secret?s MTBF when they use Asynchronous, synchronous and toggle flash? But other manufacturers have 1,500,000 1,200,000 1,000,000 MTBF. What’s there secret?
I wouldn’t focus on MTBF, the industry has no standard for measuring MTBF. Different manufacturers use different workloads to specify their MTBF. All you should really care about is what type of NAND they use. SLC, MLC, or TLC. If they use MLC or TLC NAND, make sure they use SLC caching. That’s it in a nutshell for right now. Best thing to do is read up on it on your own, there’s a lot of information out there.
Type of nand really doesn’t determine reliability of an SSD.
Not under typical workloads anyway.
What one should focus about is the controller. Thats the single most important part of the ssd and is also the #1 reason for faulires.
MTBF is really meaningless, ie more MTBF doesnt mean a more reliable drive, especially when comparing different brands.
I agree on all marks but the type of NAND for reliability. The controller is definitely where reliability is the most important, but higher density NAND flash increases bit rate error. To correct those errors ECC needs to either be programmed, or included in the controller. The type of NAND also affects endurance.
Whats the most reliable nand today?
Anything SLC based 🙂
Also, sammy’s 3D MLC comes close too. Apperently they internally tested their 128GB model and went thru 8PB of writes. Pretty mad, if its actually true.
Yeah this is true, but ECC engines in modern controllers are so powerfull and there is lots of spare area invisible to the user and controller (sandisk tlc apperently has 1/5 dedicated just for that), so it doesn’t pose that much a problem.
Crappy nand can be compensated with a proper controller. Crappy controller can’t be compensated with a proper nand.
Besides, most faulires come down to controller failing or trippin on acid, no failed nand. Some controller can actually withstand flash die faulires just fine (sandforce does that for example).
Whats the most reliable controller today?
Intel, marvell, samsung are pretty good choices with excellent track record.
Sandforce, phison, jmicron… Not so much (granted, their latter stuff got better).
I thought Intel controllers were/or made by Sandforce/Lsi?
No, Intel actually makes their own controllers too.
Intel 730 uses their inhouse controller for example.
But yes, their consumer stuff uses sandforce and is no better than other sandforce based stuff (apart from cherry picked nand).
No SLC Cache, disappointing. I’ll avoid Silicon Power SSD’s after their controller bait-and-switch tactics on the S60 and S70’s. It’s even worse than what Kingston and PNY did (and I avoid those drives, too).
Agreed. Who knows if the “chip’s close-up shows a part number of” for anything produced by these guys will be accurate down the road.
Their multiple choices of controllers used in these product lines is most definitely why their power consumption specs were generic.
I wouldn’t be too concerned about a lack of SLC cache in this drive, as it’s not using cheap TLC flash with its inherent latency and longevity concerns vs MLC. SLC hybrid drives often have issues with performance consistency due to firmware design, so sometimes simpler is better when the mfg isn’t cutting corners on flash quality.
Crucial’s MX200 is a prime example of the mixed bag that SLC hybrid design (DWA in their terminology) can be when applied to an MLC-based drive…until its firmware matures. Anandtech’s review traces are a good example of the potential compromises, mainly in latency issues when the firmware stumbles while managing the SLC-MLC combo under heavy loads. Their BX100 uses a lower end controller and is the simpler “budget” product with pure MLC but doesn’t have the glaring issues under certain loads that the MX200 does, which makes the MX200 unworthy to pay any premium for until the firmware is stabilized–especially since the BX100 is more power efficient.
The S80 is now down to $84.99 — .35/GB.
The firmware version tested in this review (7.2 as seen in the benchmark result screen shots) was outdated months before this article was published, and should have been updated to 8.0. I purchased one of these SPCC drives in late 2014 and tested the 8.0 release in January. 8.2 is the current firmware as of earlier this month.
Firmware updates are very easy using SPCC’s tool, and it automatically checks and installs the required updater when the utility is run since SPCC often swaps between Phison and Sandforce controllers in some of these product lines.
Making sure firmware is up to date is pretty important on drive reviews, especially these days as they are likely to be optimizing for PCMark 8’s more intensive testing methods (only available in the non-consumer version) vs generally prioritizing burst / light load performance in the past. I have seen negligible differences in the drive’s light load benchmark performance with the new 8.x firmwares vs the stock 7.2, but the story could be very different in the heavier PCMark 8 test traces. If you still have this drive, updated results would be appreciated.