
MEASURING PERFORMANCE
As with all of our tests, the following tests were performed after a secure erase of the drive. The drive was also conditioned with a predefined workload until it reached steady state. We also test across the entire span of the drive.
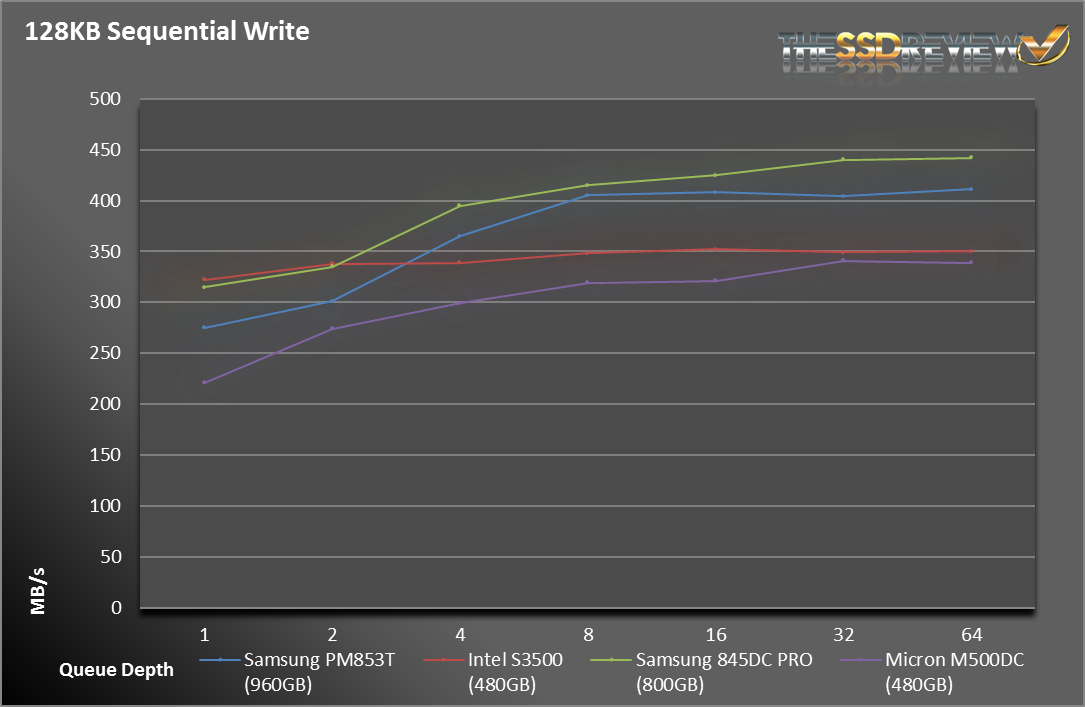
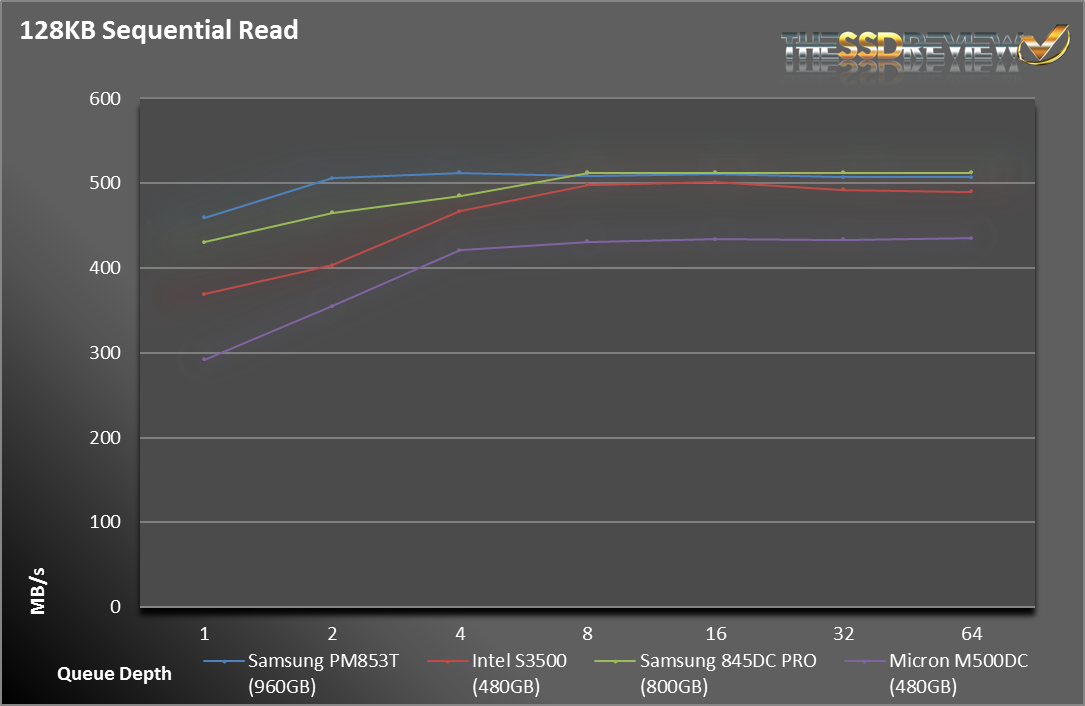
For sequential operation, the PM853T performed just as we expected. It was at or near the top in all of our results. We decided not to show the 845DC EVO in these charts simply because the results were identical, plus or minus a few MB/s.
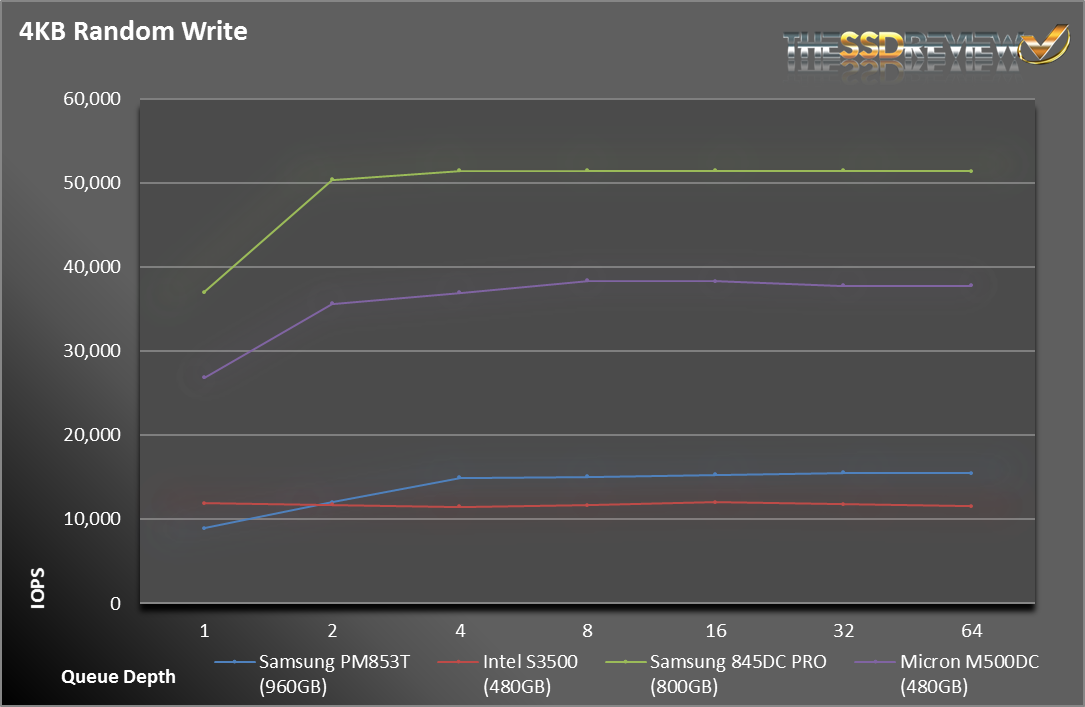
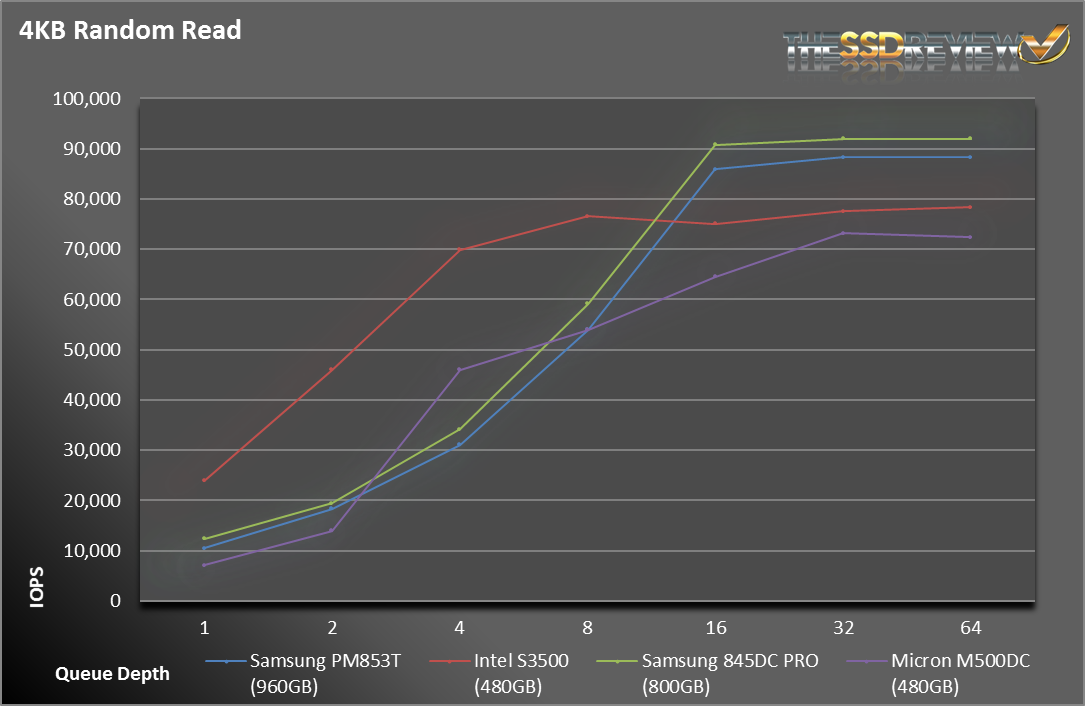
Like the 845DC EVO, the PM853T couldn’t really come close to the M500DC or the 845DC PRO for random write performance. Random reads, on the other hand, showed a strong win for the Samsung drives as queue depth increased.
When compared to SSDs in the same price range, the PM853T gives a solid performance, but is still no match to the higher priced drives when it comes to write performance.
SNIA IOPS TESTING
The Storage Networking Industry Association has an entire industry accepted performance test specification for solid state storage devices. Some of the tests are complicated to perform, but they allow us to look at some important performance metrics in a standard, objective way.
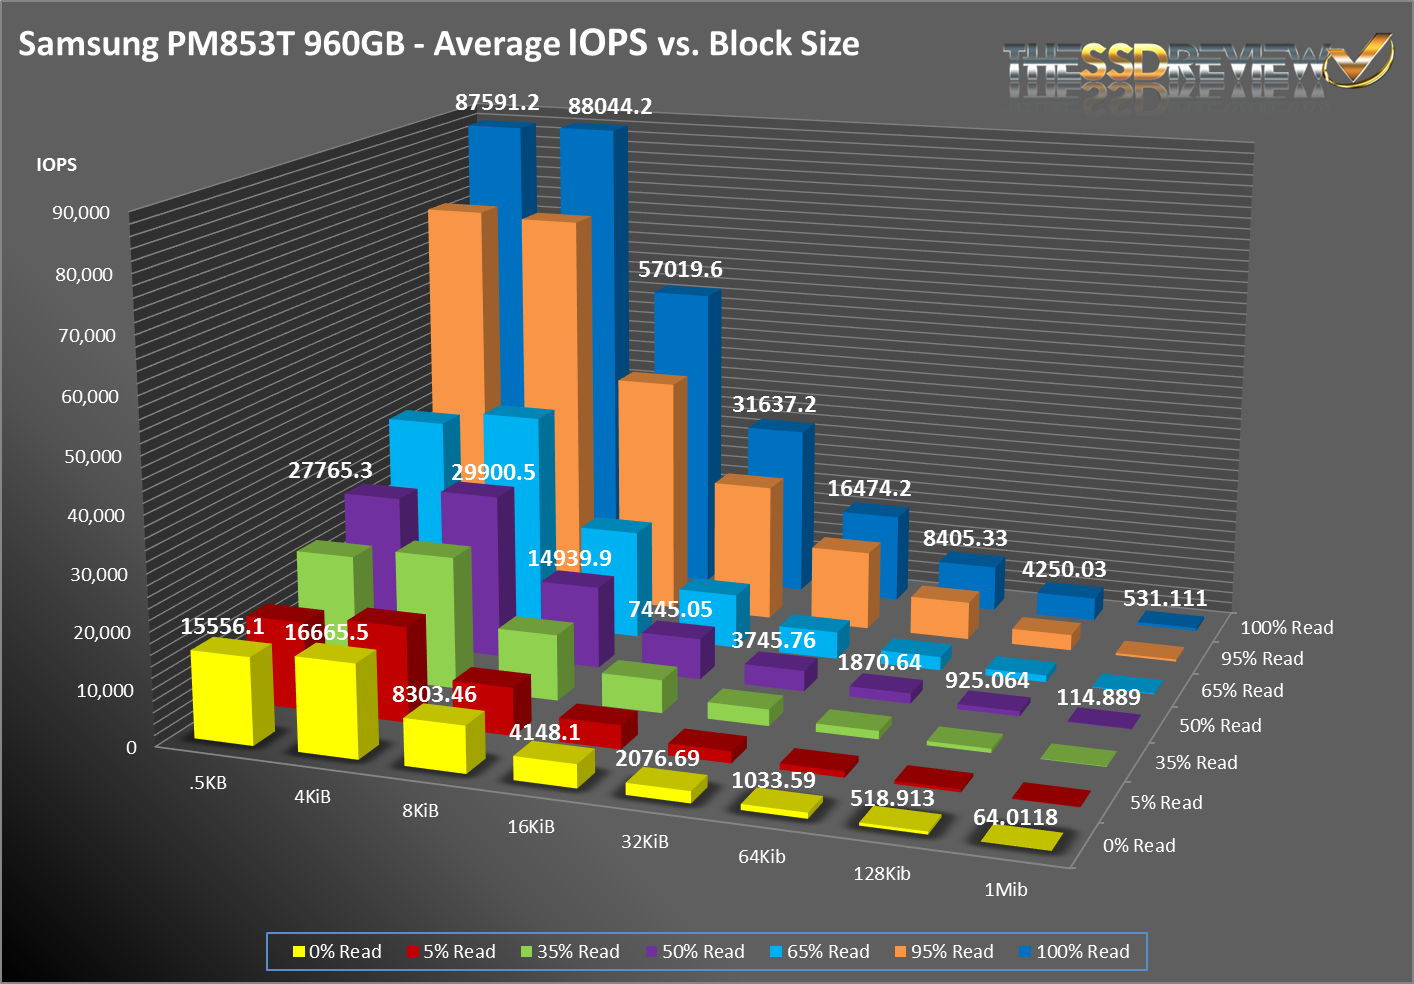
SNIA’s Performance Test Specification (PTS) includes IOPS testing, but it is much more comprehensive than just running 4KB writes with IOMeter. SNIA testing is more like a marathon than a sprint. In total, there are 25 rounds of tests, each lasting 56 minutes. Each round consists of 8 different block sizes (512 bytes through 1MB) and 7 different access patterns (100% reads to 100% writes). After 25 rounds are finished (just a bit longer than 23 hours), we record the average performance of 4 rounds after we enter steady state.
- Preconditioning: 3x capacity fill with 128K sequential writes
- Each round is composed of .5K, 4K, 8K, 16K, 32K, 64K, 128K, and 1MB accesses
- Each access size is run at 100%, 95%, 65%, 50%, 35%, 5%, and 0% Read/Write Mixes, each for one minute.
- The test is composed of 25 rounds (one round takes 56 minutes, 25 rounds = 1,400 minutes)
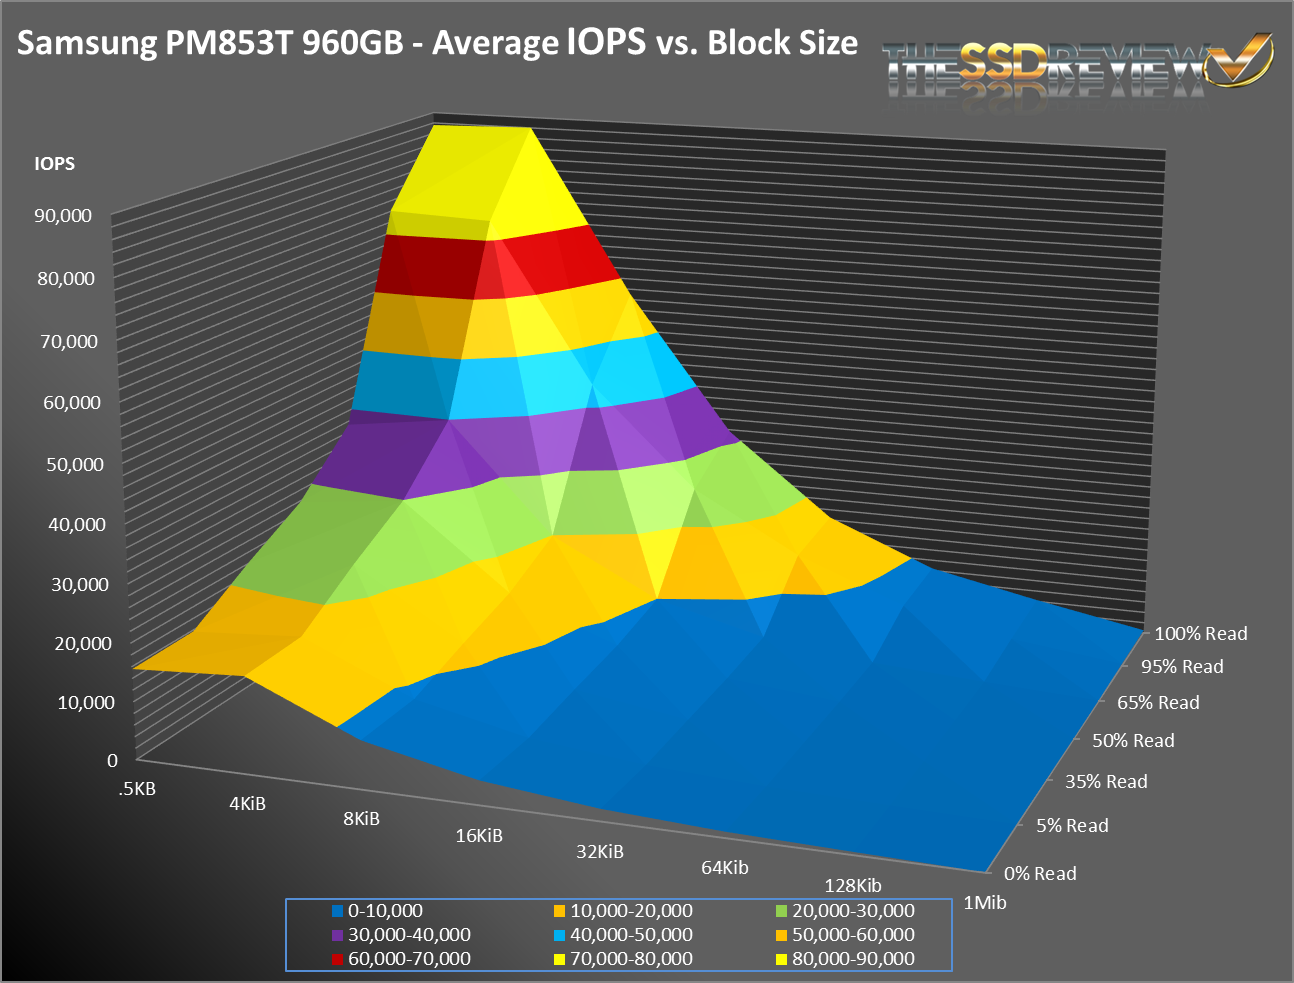
In our SNIA testing, the PM853T performed slightly better than the 845DC EVO. It doesn’t necessarily show up on the graphs above, but we can see that the variance across the 25 rounds is much lower than with the 845DC EVO. We know that the PM853T has slightly different firmware that addresses different workloads and also that it has more consistent write performance, both of which seem to be in play with these tests.
Other than those minor differences, both drives are solid performers.
Thank you for the thorough review. Also: dem charts and graphs! Very helpful. The price point combined with the performance and current gen tech put this particular drive in my sights. Well written.
Thanks Drew, I appreciate it.
Hmm, seeing how this is using 19nm TLC, there just might be a chance this is losing read performance over time aswell…
No point buying this drive until it has been tested for at least a few weeks with ‘old data’.
Samsung TLC nand is not reliable at least from a performance standpoint currently. If and when a firmware update is available and users can test longer term results, then this drive may be a consideration.
Is my math off, or does the drive have weak write endurance? 78TB for the 240GB model, 158TB for the 480GB model & 315TB for the 960GB model? That’s basically consumer level?