
TEST SETUP AND METHODOLOGY
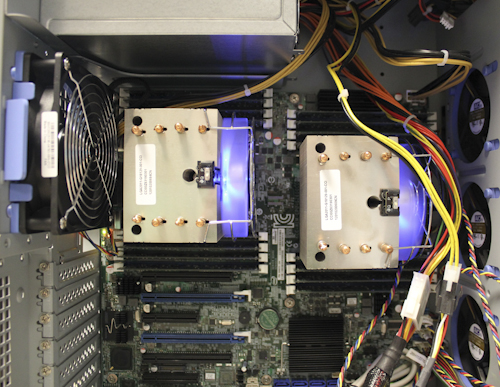 In testing the Samsung PM853T, along with all enterprise drives, we focus on long term stability. In doing so, we stress products not only to their maximum rates, but also with workloads suited to enterprise environments.
We use many off-the-shelf tests to determine performance, but we also have specialized tests to explore specific behaviors we encounter. With enterprise drives, you will see that we do not focus on many consumer level use-cases.
Our hope is that we present tangible results that provide relevant information to the buying public.
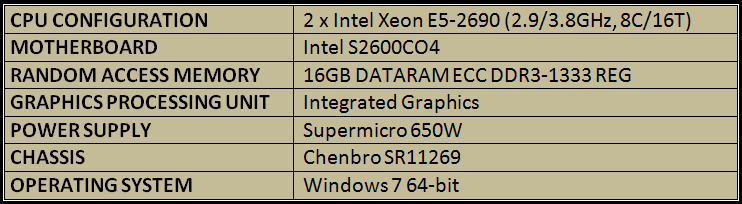
LATENCY
To specifically measure latency, we use a series of 512b, 4K, and 8K measurements. At each block size, latency is measured for 100% read, 65% read/35% write, and 100% write/0% read mixes.
The PM853T posted initial latency results that are in line with what we saw with the 845DC EVO. It was slightly better than the SM843 and the Intel S3500.
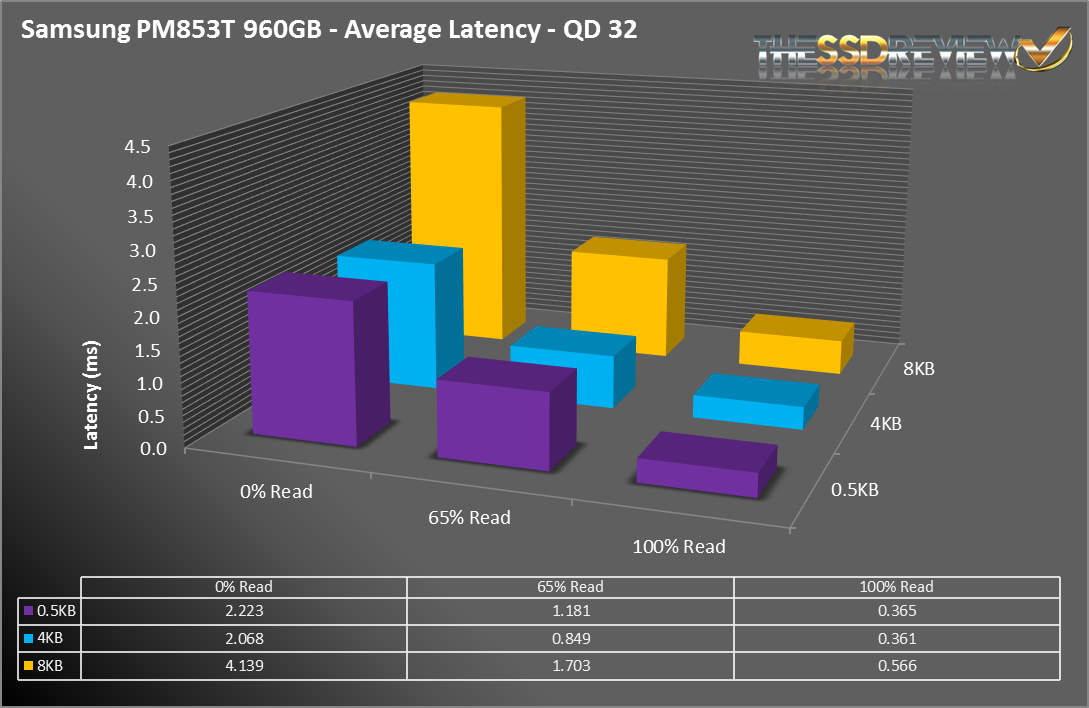
As with the 845DC EVO, the 853T scored very solid numbers in our maximum latency tests. The maximum latency was slightly lower across the board than the 845DC EVO. Once again, there are so few differences that between the two that these results were not surprising.
ADVANCED WRITE TESTING
As we talked about in our Micron P400m SSD Review, SSDs have different performance states. Since the Samsung PM853T is an enterprise SSD, we will focus on steady state performance. With the following tests, we stressed the drive using random 4KB write workloads across the entire span for at least 24 hours. This is more than enough to achieve steady state. The following graph is showing the latency and IOPS across an 11 hour span.
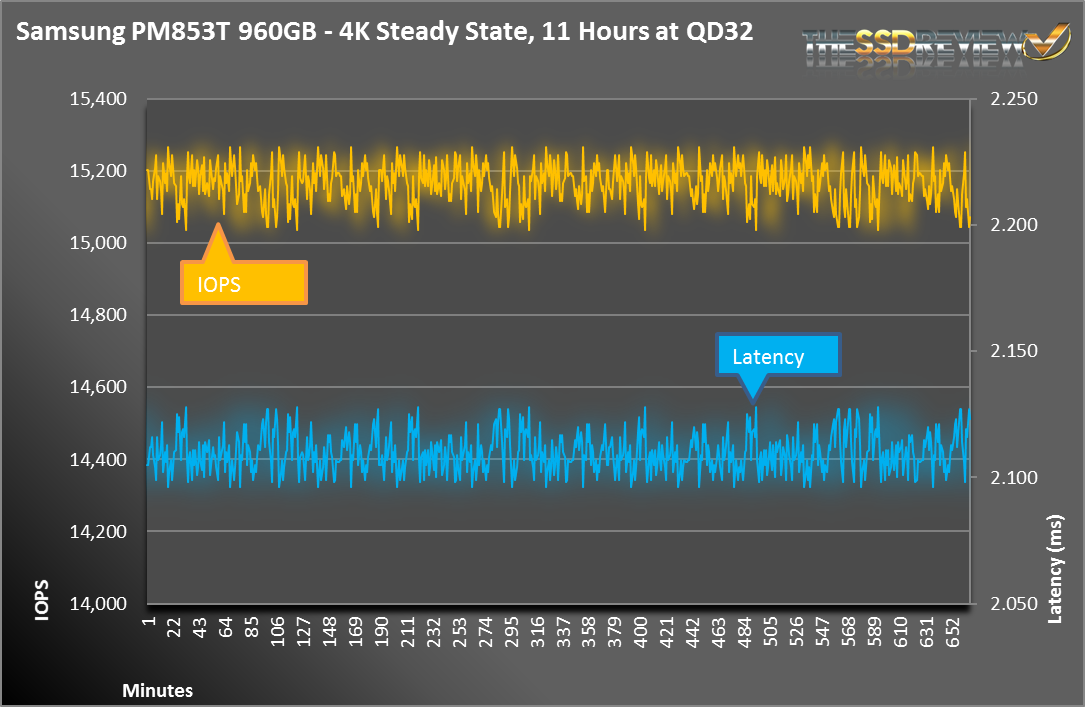
Looking at 1 minute averages, the PM853T looks great. It stayed predictable throughout our entire run.
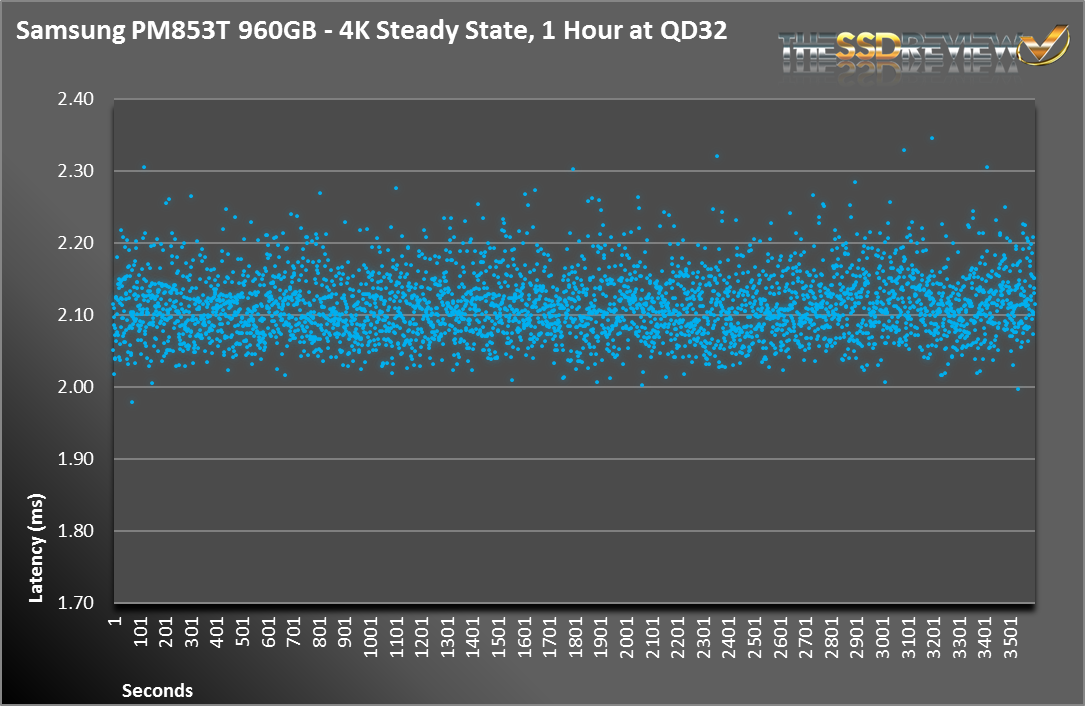
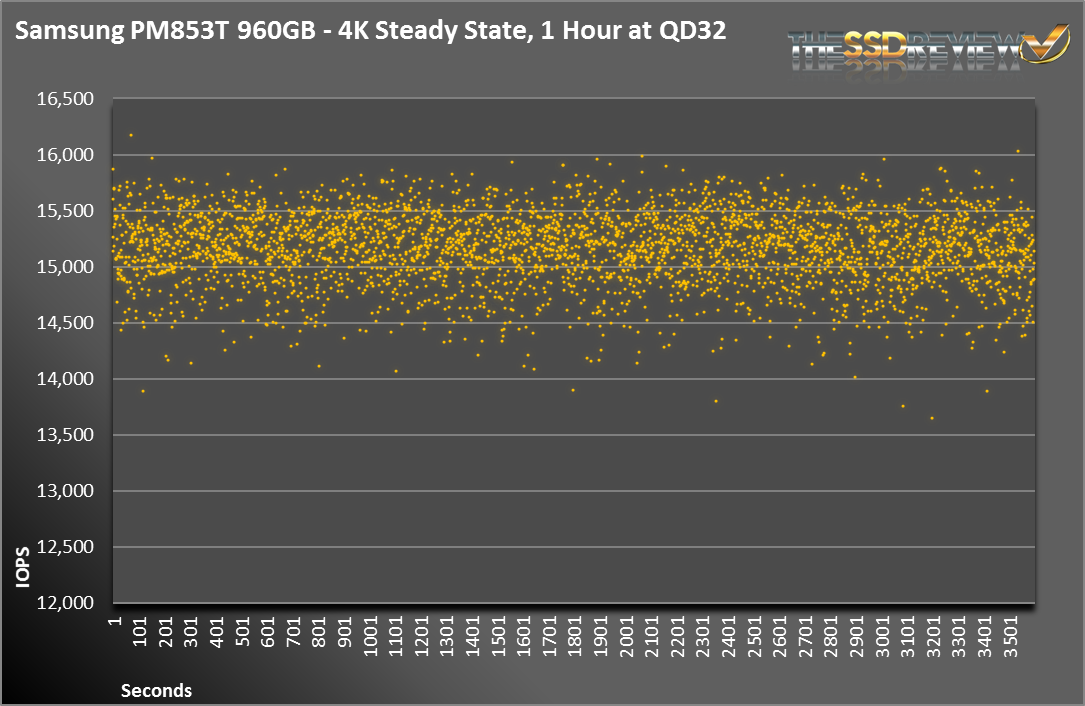
Now we are zooming into the last hour of our testing and looking at 1 second averages. When looking back at our testing on the 845DC EVO, we saw a drive rated at 14K IOPS perform fairly consistently at 15K IOPS. With the PM853T, we see the same average of 15K IOPS, but the grouping of data points is much more compact leading to a lower standard deviation. This is one area where the tweaking of the firmware has led to a noticeable and measurable result.
Thank you for the thorough review. Also: dem charts and graphs! Very helpful. The price point combined with the performance and current gen tech put this particular drive in my sights. Well written.
Thanks Drew, I appreciate it.
Hmm, seeing how this is using 19nm TLC, there just might be a chance this is losing read performance over time aswell…
No point buying this drive until it has been tested for at least a few weeks with ‘old data’.
Samsung TLC nand is not reliable at least from a performance standpoint currently. If and when a firmware update is available and users can test longer term results, then this drive may be a consideration.
Is my math off, or does the drive have weak write endurance? 78TB for the 240GB model, 158TB for the 480GB model & 315TB for the 960GB model? That’s basically consumer level?